A random weapon in the war on terror, from Newsweek.
Airport security personnel at Los Angeles International Airport are now randomly being deployed; the thinking behind it is that if there's no pattern in where the security people are, it's harder for potential attackers to find a hole in the system that can be exploited.
This is the idea of a "mixed strategy" in game theory. There are various things that each of the two parties can do, and the payoffs to each player in each situation are known. It often turns out that the optimal strategy for one player might be to do one thing sixty percent of the time, say, and another thing forty percent of the time -- but that doesn't mean they should do some sort of strict alternation. Rather, they should choose which thing to do at each time at random.
The canonical example of this, I think, is pitch choice in baseball, where the pitcher chooses his pitches at random and the batter chooses what he will expect (and therefore swing at) also at random. But I'm not sure to what extent I believe it actually applies there because the strategy is different on each count. (And it would be incredibly difficult to study. You can maybe get information on what kind of pitch the pitcher pitched. But how could you know what the batter expected?)
The theory of mixed strategies, though, assumes that both parties have perfect information. So it's not exactly the same thing; the terrorists and the airport security don't have such information. Even if they think they know where there's a hole, how do they know they just haven't been watching long enough? But the idea seems reasonable; security people develop patterns, and if you can avoid creating those patterns you can avoid having them exploited.
P.S. I had to mention baseball because the Phillies won today, and are therefore in the playoffs. And the Mets lost; they have to go home now. I was at the Phillies game. See a picture of a sad Mets fan from the New York Times. At one point the odds of the Mets not making the playoffs were 500 to 1, according to Baseball Prospectus. But that's actually not the worst collapse ever; the '95 Angels beat 8800-to-1 odds. (The '64 Phillies are only tenth, according to that list.)
30 September 2007
29 September 2007
In which baseball people continue to think weird things
Apparently conventional wisdom in baseball is that a leadoff walk is more likely to lead to a multi-run inning than a leadoff home run.
(This was said by the Smart People on Fox with one out in the bottom of the seventh, Greg Dobbs at bat for the Phillies. Aaron Rowand led off the inning with a home run, then Jayson Werth flied out.)
But they asked the people at Stats, Inc. about this, and it turns out the conventional wisdom is wrong -- a lead-off home run is more likely to lead to a multi-run inning.
Of course! It's a lot easier to get two runs in an inning if you already have one. I know conditional probabilities are counterintuitive, but they're not that counterintuitive.
(As of right now, in this inning there are runners on first and second, with one out, and one run scored. The Phillies are down 4 to 1.)
Baseball commentators say other mathematically unsound things: see here. There are plenty of others but I don't write them all down.
Potlucks and fractals
Last night, I was at a party thrown by a friend of mine.
This friend of mine lives at a house that has a potluck dinner most Wednesday evenings; I live three blocks away, so I go fairly often. I wasn't there last Wednesday, though, because it had been a long day and I was tired.
(Often there inadvertently seems to be a "theme" to the potluck despite nobody actually trying to do this, because pretty much any interesting-seeming coincidence counts. Last week it was the "night of the seven grains", as the seven people there brought dishes with seven different grains -- normal rice, arborio rice, buckwheat, wheat, two that I don't remember, and corn. Yeah, yeah, I know, you're thinking that arborio rice is rice. The point here is that if one interprets things widely enough there's always some sort of coincidence -- lots of today's foods are rectangular, or are yellow, or whatever. I think we once even said that the theme was "things with spices in them".)
While I wasn't there on Wednesday, people apparently came to discussing the existence of "some sort of crazy triangle fractal thing", and they had lamented that I wasn't there. I was eventually able to figure out that they were talking about the Sierpinski gasket, which is obtained by taking an equilateral triangle, removing a smaller triangle (half the size) from the middle to obtain three triangles with half the side length of the original triangle, and repeating ad infinitum. Click here for an illustration.
While this is nice, my favorite way to think of the Sierpinski gasket is via the so-called chaos game (more formally, an "iterated function system"), which is animated here. Start by picking three points (call them the red, yellow, and blue points) in the plane, and a random point x0 in the triangle which they bound. Plot that random point. Now, pick one of the three corner points (red, yellow, or blue) at random, each with probability 1/3; then pick the point halfway between x0 and that corner point, and call it x1. Pick a corner point again at random; the point halfway between x1 and that corner point is x2. Do this a thousand times or so and you get a nice picture. An applet showing more examples of such iterated function systems is available at cut-the-knot.org.
Why does this work? Basically, if you take the whole Sierpinski gasket, and contract it by a factor of two towards one of its edges, you get one of its three self-similar parts; call these the "red", "yellow", and "blue" parts, as in the picture at left.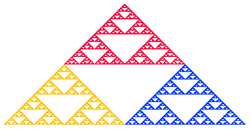 Now, x0 is some distance d from the gasket; the distance from x1 to the gasket is d/2, the distance from x2 to the gasket is d/4, and so on -- thus as the sequence is generated we get points closer and closer to the gasket. The gasket has measure zero, so with probability one we never actually end up with a point in it -- but we end up as close as we like after a very short time.
Although I'm not an expert in this, from some crude experimentation it looks like if you replace "each with probability 1/3" above with some other distribution, you end up with a gasket that is much more concentrated near the corners that you go to with high probabilities.
Edited, 5:06 pm: other surprising places where fractals appear include in the study of fast algorithms for multiplication (which also includes an explanation of the multiplication bug in Excel 2007), found via Good Math, Bad Math.
This friend of mine lives at a house that has a potluck dinner most Wednesday evenings; I live three blocks away, so I go fairly often. I wasn't there last Wednesday, though, because it had been a long day and I was tired.
(Often there inadvertently seems to be a "theme" to the potluck despite nobody actually trying to do this, because pretty much any interesting-seeming coincidence counts. Last week it was the "night of the seven grains", as the seven people there brought dishes with seven different grains -- normal rice, arborio rice, buckwheat, wheat, two that I don't remember, and corn. Yeah, yeah, I know, you're thinking that arborio rice is rice. The point here is that if one interprets things widely enough there's always some sort of coincidence -- lots of today's foods are rectangular, or are yellow, or whatever. I think we once even said that the theme was "things with spices in them".)
While I wasn't there on Wednesday, people apparently came to discussing the existence of "some sort of crazy triangle fractal thing", and they had lamented that I wasn't there. I was eventually able to figure out that they were talking about the Sierpinski gasket, which is obtained by taking an equilateral triangle, removing a smaller triangle (half the size) from the middle to obtain three triangles with half the side length of the original triangle, and repeating ad infinitum. Click here for an illustration.
While this is nice, my favorite way to think of the Sierpinski gasket is via the so-called chaos game (more formally, an "iterated function system"), which is animated here. Start by picking three points (call them the red, yellow, and blue points) in the plane, and a random point x0 in the triangle which they bound. Plot that random point. Now, pick one of the three corner points (red, yellow, or blue) at random, each with probability 1/3; then pick the point halfway between x0 and that corner point, and call it x1. Pick a corner point again at random; the point halfway between x1 and that corner point is x2. Do this a thousand times or so and you get a nice picture. An applet showing more examples of such iterated function systems is available at cut-the-knot.org.
Why does this work? Basically, if you take the whole Sierpinski gasket, and contract it by a factor of two towards one of its edges, you get one of its three self-similar parts; call these the "red", "yellow", and "blue" parts, as in the picture at left.
Now, x0 is some distance d from the gasket; the distance from x1 to the gasket is d/2, the distance from x2 to the gasket is d/4, and so on -- thus as the sequence is generated we get points closer and closer to the gasket. The gasket has measure zero, so with probability one we never actually end up with a point in it -- but we end up as close as we like after a very short time.Although I'm not an expert in this, from some crude experimentation it looks like if you replace "each with probability 1/3" above with some other distribution, you end up with a gasket that is much more concentrated near the corners that you go to with high probabilities.
Edited, 5:06 pm: other surprising places where fractals appear include in the study of fast algorithms for multiplication (which also includes an explanation of the multiplication bug in Excel 2007), found via Good Math, Bad Math.
28 September 2007
Nested radicals, smoothness, and simplification
I saw an expression involving a nested radical, namely
 .
.
(Write φ = (1 + φ)1/2 and solve for φ.) The Wikipedia article on nested radicals led me to Simplifying Square Roots of Square Roots by Denesting. The authors tell us that:
This reminds me of a couple things that happened in my class yesterday. First, I was defining what it means for a curve to be smooth; our definition was that the curve given by the vector function r(t) is smooth if r'(t) is continuous and never zero, except perhaps at the endpoints of the interval over which it's defined. (This makes smoothness a property of a parametrization, which is a bit counterintuitive. I suppose that one could define a curve -- as an abstract set of points -- to be smooth if it has a smooth parametrization. Although I haven't worked it out, I assume that if a curve has a smooth parametrization, the arc-length parametrization is smooth.) One of the students said "but the professor said 'smooth' means something else!" I'm not sure if the professor actually said "smooth means X" or if he said "some people think smooth means X", but it's a good point. (In particular, "smooth" often seems to mean that a function has infinitely many continuous derivatives.)
Second, the article is about using computer algebra systems to simplify expressions like

where the left-hand side is "simpler"; sometimes my students worry that they are not presenting their answer in the simplest form. While I'll accept any reasonably simple answer (unless the problem statement specifies a particular form), it is remarkably difficult to define what "simple" means.
One rule I have figured out, though, is that 4x - 4z - 8 = 0 should be simplified to x - z - 2 = 0 by dividing out the common factor. In general, given a polynomial with rational coefficients, one probably wants to multiply to clear out the denominators and then divide by any common integer factor of the new coefficients, so the resulting coefficients are relatively prime integers. The article addresses this sort of "canonicalization" in the context of nested radicals. I keep telling my students that they should keep that sort of thing in mind, especially since our tests will be mostly multiple-choice.
(Sometimes I'm tempted to define "simplest" as "requires the fewest symbols"... but how does one prove that some 100-character expression one has written can't be written in 99 characters? And how do you count something like "f(x, y)= (x+y)1/2 - (x-y)1/2, where x = foo and y = bar?" ("foo" and "bar" are supposed to be very complicated expressions.) Do you plug foo and bar into the original equation and then count the characters, or do you count the actual characters that are between the quotation marks?)
(Write φ = (1 + φ)1/2 and solve for φ.) The Wikipedia article on nested radicals led me to Simplifying Square Roots of Square Roots by Denesting. The authors tell us that:
The term surd is used by TeX as the name for the symbol √ Maple has a function called surd that is similar to the nth root defined here; like all good mathematical terms, the precise definition depends upon the context. In general, a mathematical term that does not have several conflicting definitions is not important enough to be worth learning.
This reminds me of a couple things that happened in my class yesterday. First, I was defining what it means for a curve to be smooth; our definition was that the curve given by the vector function r(t) is smooth if r'(t) is continuous and never zero, except perhaps at the endpoints of the interval over which it's defined. (This makes smoothness a property of a parametrization, which is a bit counterintuitive. I suppose that one could define a curve -- as an abstract set of points -- to be smooth if it has a smooth parametrization. Although I haven't worked it out, I assume that if a curve has a smooth parametrization, the arc-length parametrization is smooth.) One of the students said "but the professor said 'smooth' means something else!" I'm not sure if the professor actually said "smooth means X" or if he said "some people think smooth means X", but it's a good point. (In particular, "smooth" often seems to mean that a function has infinitely many continuous derivatives.)
Second, the article is about using computer algebra systems to simplify expressions like
where the left-hand side is "simpler"; sometimes my students worry that they are not presenting their answer in the simplest form. While I'll accept any reasonably simple answer (unless the problem statement specifies a particular form), it is remarkably difficult to define what "simple" means.
One rule I have figured out, though, is that 4x - 4z - 8 = 0 should be simplified to x - z - 2 = 0 by dividing out the common factor. In general, given a polynomial with rational coefficients, one probably wants to multiply to clear out the denominators and then divide by any common integer factor of the new coefficients, so the resulting coefficients are relatively prime integers. The article addresses this sort of "canonicalization" in the context of nested radicals. I keep telling my students that they should keep that sort of thing in mind, especially since our tests will be mostly multiple-choice.
(Sometimes I'm tempted to define "simplest" as "requires the fewest symbols"... but how does one prove that some 100-character expression one has written can't be written in 99 characters? And how do you count something like "f(x, y)= (x+y)1/2 - (x-y)1/2, where x = foo and y = bar?" ("foo" and "bar" are supposed to be very complicated expressions.) Do you plug foo and bar into the original equation and then count the characters, or do you count the actual characters that are between the quotation marks?)
They're building a science thing!
From The Onion: Scientists Ask Congress To Fund $50 Billion Science Thing.
That's right, folks. Mathematics is all about numbers, at least in the eyes of Normal People. But I can't count how many times I've looked at a blackboard during a lecture and realized there wasn't a single number there.
Another diagram presented to lawmakers contained several important squiggly lines, numbers, and letters. Despite not being numbers, the letters were reportedly meant to represent mathematics too. The scientists seemed to believe that correct math was what would help make the science thing go.
That's right, folks. Mathematics is all about numbers, at least in the eyes of Normal People. But I can't count how many times I've looked at a blackboard during a lecture and realized there wasn't a single number there.
27 September 2007
What is the simplest problem you cannot solve?
I'm currently reading The Cauchy-Schwarz Master Class (link goes to MAA review, which pretty well explains the book's raison d'etre and contents) by J. Michael Steele. (How did I find this book? I'm taking Steele's course "Probability Inequalities and Machine Learning"; he alludes to this book every so often.)
It is full of interesting inequalities, and I may have something to say about them later, but I just wanted to share the following, where Steele is talking about George Polya and his book How to Solve It:
I think this is worth remembering.
It is full of interesting inequalities, and I may have something to say about them later, but I just wanted to share the following, where Steele is talking about George Polya and his book How to Solve It:
Some of the richest of Polya's suggestions may be repackaged as the modestly paradoxical question: "What is the simplest problem you cannot solve?".... Perhaps no other discipline can contribute more to one's effectiveness as a solver of mathematical problems.
I think this is worth remembering.
Fun with fugues
At Science after Sunclipse, Blake Stacey links to some videos from Stephen Malinowski's Music Animation Machine. The Music Animation Machine animates music; the basic idea is that notes are represented by rectangles, the length of which corresponds to the length of the note. What I found particularly interesting was that the videos use color to represent either:
Johann Sebastian Bach, Toccata and Fugue in D Minor:
Frederic Chopin, Etude, opus 10 #7:
The harmonic coloration is based on the circle of fifths, which is an interesting solution to the problem that notes which are close together in pitch are not close together in some sort of "harmonic space".
I find myself wondering if the coloring based on voice could be automated. This would be trivial for things written entirely in, say, standard four-part voice leading as taught in an introductory music theory class, because there are always exactly four notes at any given time and the voices don't cross; it would be very nontrivial for actual music. (This isn't just a musical problem, believe it or not. A related problem is as follows: a baseball team has five starting pitchers, which it uses in a pitching rotation: ideally pitcher n pitches on days n, n+5, n+10, ... But there are off days, people get hurt, and so on. How do you decide when one pitcher has "replaced" another in the rotation? The people at Baseball Prospectus have thought about this -- sorry I can't find the link -- but their solutions basically involve just staring at a list of who pitched what day and writing numbers next to them kind of arbitrarily. It's not quite the same thing, though, because there's only one starting pitcher per game (relief pitchers are used in a much more ad hoc manner) but notes are played simultaneously. I suspect there are other problems of this sort where there are logical ways to sort some sequence of things into bins -- musical voices, rotation slots, and so on -- but none come to mind.)
The sort of notation they're using here seems like a logical historical antecedent of present-day musical notation (though I don't know enough about the history to know if it is); the main differences are that in modern notation we decide that seven of the notes in each octave are more important than the other five (and enshrine this in the notation) and we don't write a whole note as being, say, sixteen times as long as a sixteenth note. This is probably a good thing from the point of view of readability. It also resembles a player piano roll (modulo coloring) which I doubt is a coincidence.
Oh, and you have to watch the "Oops, I Did It Again" fugue, which I found from Good Math, Bad Math:
- the "voices" in the score, as in the first video below (Bach), and
- harmonic information, as in the second video below (Chopin)
Johann Sebastian Bach, Toccata and Fugue in D Minor:
Frederic Chopin, Etude, opus 10 #7:
The harmonic coloration is based on the circle of fifths, which is an interesting solution to the problem that notes which are close together in pitch are not close together in some sort of "harmonic space".
I find myself wondering if the coloring based on voice could be automated. This would be trivial for things written entirely in, say, standard four-part voice leading as taught in an introductory music theory class, because there are always exactly four notes at any given time and the voices don't cross; it would be very nontrivial for actual music. (This isn't just a musical problem, believe it or not. A related problem is as follows: a baseball team has five starting pitchers, which it uses in a pitching rotation: ideally pitcher n pitches on days n, n+5, n+10, ... But there are off days, people get hurt, and so on. How do you decide when one pitcher has "replaced" another in the rotation? The people at Baseball Prospectus have thought about this -- sorry I can't find the link -- but their solutions basically involve just staring at a list of who pitched what day and writing numbers next to them kind of arbitrarily. It's not quite the same thing, though, because there's only one starting pitcher per game (relief pitchers are used in a much more ad hoc manner) but notes are played simultaneously. I suspect there are other problems of this sort where there are logical ways to sort some sequence of things into bins -- musical voices, rotation slots, and so on -- but none come to mind.)
The sort of notation they're using here seems like a logical historical antecedent of present-day musical notation (though I don't know enough about the history to know if it is); the main differences are that in modern notation we decide that seven of the notes in each octave are more important than the other five (and enshrine this in the notation) and we don't write a whole note as being, say, sixteen times as long as a sixteenth note. This is probably a good thing from the point of view of readability. It also resembles a player piano roll (modulo coloring) which I doubt is a coincidence.
Oh, and you have to watch the "Oops, I Did It Again" fugue, which I found from Good Math, Bad Math:
Probabilities in the wild-card race
A quick question: what's the probability that the four teams from a given league of Major League Baseball which make it to the playoffs are actually the best four teams in that league?
For those who aren't familiar with MLB's playoff structure -- there are two leagues, the National and the American. The National League has sixteen teams, divided into divisions of five, six, and five; the American League had fourteen teams, divided into divisions of five, five, and four. (If you're wondering why they don't have fifteen teams in each league, it's for scheduling reasons. Baseball teams play nearly every day, and don't play teams in the other league except during certain prescribed times of the season; if there were an odd number of teams in a league then one team would always be idle.) For the purposes of not wanting to deal with a zillion special cases, what follows will actually be a computation for a fifteen-team league, divided into three five-team divisions.
In each league the team with the best win-loss record in each division makes the playoffs; furthermore the best team among teams that didn't win its division also makes the playoffs, as the "wild card", for a total of four teams in each league.
I'll make the simplifying assumption that a team's record accurately reflects its skill. This is quite an assumption. First, a team that is exactly average should win half its games, or 81 games out of a 162-game season; but the games are independent and so the standard deviation of the number of games they win is ((162)(0.5)(0.5))1/2, or about 6.4. Baseball teams tend to be tightly bunched enough that that's a pretty big measurement error. Second, teams face different schedules, mostly because they play about 18 games against each team in their division and about 6 games against teams not in their division but in the same league. Third, we'll assume that good teams have no propensity to be in a particular division.
Thus, we can model the problem as follows: partition the set {1, 2, ..., 15} into three blocks of five, uniformly at random. (1 represents the best team, 15 the worst.) What is the probability that two of the numbers {1, 2, 3, 4} are in one block and each of the remaining two is in a different block?
For example, consider the 2001 American League. (Why? There were no ties in the 2001 AL. I don't want to have to figure out to resolve ties.) The best team were the Seattle Mariners, with 116 wins, in the West Division; we put a 1 in a box corresponding to that division. The second best team was the Oakland A's, also in the West Division; we put a 2 in the same box as the 1. The third-best team was the New York Yankees, in the East; we put a 3 in a different box. The fourth-best team was the Cleveland Indians, in the Central; we put a 4 in the box which is still empty. And so on; in the end we get the partition
East = {3, 7, 8, 13, 14}
Central = {4, 5, 6, 11, 12}
West = {1, 2, 9, 10}
and this is the sort of event we're looking for. (Note that "the best four teams make the playoffs" is different from "the wild card comes in fourth"; in the 2001 AL the wild card was the A's, who came in second.)
Anyway, the probability we seek is not hard to compute. First, place the first team in some division; they have a 1/3 chance of being in any division. Call the division they land in A.
Then the second team also must be in some division. There are 14 "slots" left, four of them in division A. So with probability 4/14 the best two teams are in the same division, A; with probability 10/14 one is in A and the other is in B. (The 2001 AL is of the first type.)
Now, we place the third team.
Say teams 1, 2 were both in A; then with probability 3/13 team 3 is also in A (and we lose) and with probability 10/13 team 3 is in some other division, called B. So with probability (4/14)(10/13), teams 1 and 2 are in A and team 3 is in B.
Say team 1 is in A and team 2 is in B, which occurs with probability 10/14; then with probability 8/13 team 3 is in a division that already has a team in it (A or B) and with probability 5/13 it is not.
So after placing three teams, the probability is (4/14)(10/13) + (10/14)(8/13) = 120/182, or nearly two-thirds, that two are in the same division and one is in a different one. The probability is (10/14)(5/13) = 50/182 that all three are in different divisions.
Finally, if we're in the first of those cases, then we need to place the fourth team in the division which contains none of the first three; there are five slots for that team out of twelve, so that contributes (120/182)(5/12) = 600/2184 to the probability. If we're in the second case, we can place the fourth team freely, contributing (50/182)(12/12) = 600/2184. So the probability that the four best teams are the three division winners and the wild card is 1200/2184, or about 55 percent.
The probability that the three division winners are the best teams and the wild card is fourth-best is exactly half the probability that the three division winners and the wild card are collectively the four best teams, which is not necessarily something you would have expected.
In a league with three n-team divisions, as n goes to infinity, the corresponding probability is slightly lower, I believe 4/9.
Since the introduction of the wild card, there have been twelve full seasons played (1995-2006) in each league, for a total of twenty-four league-years. In fifteen of those leagues, the four teams with the best records made the playoffs. In two (1996 NL and 1998 AL), there was a tie for fourth-best in the league, and the three best teams and one of the two fourth-best teams made the playoffs. In the other seven, something else happened. So two-thirds of the time in reality, the four teams with the best records have made the playoffs; that differs from my prediction of 55 percent, but not by much.
What happens "in general"? I don't know. This analysis was all about counting up different cases, which is something I wouldn't want to do in general (I only did it because this particular case was one I was interested in). Finding probabilities like this in general will take a bit more cleverness.
26 September 2007
Parallel universes?
Recently it's been reported at Slashdot that a mathematical answer to the question of parallel universes exists.
(They used the word "mathematical", which should have been my first clue that I shouldn't be reading it. "Mathematical" means "I'm trying, and failing, to use math".)
Anyway, a bit of combing through the Slashdot comments turned up this article and this one from New Scientist. It seems reasonably clear that somewhere there is some work, and what this work purportedly shows is that the many-worlds interpretation of quantum mechanics is consistent. One of the articles I found said that the work was done by David Deutsch, David Wallace, and Simon Saunders, and was presented at a conference at the Perimeter Institute for Theoretical Physics; I think that the articles are referring to this talk by David Wallace, but they might be referring to a talk by Saunders at the same conference.
Basically, what the many-worlds theory says is that parallel universes are constantly branching off of ours whenever any sort of observation occurs, therefore causing the collapse of a wavefunction.
Of course, events like those are happening all the time. Where are these parallel universes? And I'm not even going to try to think about how many of them there are, because the number is obscenely ridiculous. How many wavefunctions are collapsing around you right now? And the whole structure is branching. Let's say that every second, somewhere in the universe, exactly one wavefunction collapses, and there are two possible pure states that it could collapse to. The universe is about 5 × 10¹⁷ seconds old, so the number of universes you'd need to make this work is two to that power. Occam is rolling over in his grave. Except maybe in the universe these people are in, Occam never existed.
Besides, we can't see these other universes. Isn't that convenient? Perhaps the two major interpretations of quantum mechanics -- the probabilistic interpretation and the many-worlds interpretation -- are just two different formalisms for understanding the same thing. It's easy to picture this giant combinatorial tree of universes; it's harder to picture superpositions.
You're offended by the idea that "God plays dice with the universe". So you call zillions of other universes into existence because you can't handle it? Einstein would be ashamed.
(Edited, 12:37 pm: today's Questionable Content refers to the many-worlds interpretation.
Fun with images! (Mostly about math tattoos.)
Stokes' theorem graffiti. In a bathroom. Only in Camberville. (I would have said "only in Cambridge", but this particular graffito is actually in Somerville. Diesel Cafe, to be precise; there was a summer where I spent a lot of time there doing math, so I'm not surprised.)
and a tattoo of the Y combinator, which is part of this collection of images of science tattoos. Other mathematically inspired tattoos in that collection are:
I can think of others. An ex-girlfriend had an infinity symbol tattooed on her (although I believe that was more of a literary thing than a scientific one). A friend of mine has
¬ (p ∧ ¬ p))
tattooed on his leg. A friend of a friend in college had the Taylor series for sine on her arm. It's written out, as

except with exactly enough terms to go once around her arm; it's not in the more compact form
 .
.
I don't have any tattoos; I can't think of anything I'd want permanently inked on me. But if I were to get a tattoo, the equation

would be up there. (I had it written on my wall in college.) I've heard it called the "computer scientist's identity"; it's an analytic version of the fact that every positive integer has a unique binary expansion. The left-hand side expands to
(1+z1)(1+z2)(1+z4)(1+z8)...
and you can imagine expanding that out; then you get something like
1 + z1 + z2 + z2+1 + z4 + z4+1 + z4+2 + z4+2+1 + ...
where each sum of distinct powers of two appears as an exponent exactly once. The right-hand side is the geometric series
1/(1-z) = 1 + z + z2 + z3 + ...
and in order for these two expressions to be equal, the coefficient of zn in each of them has to be equal. All the coefficients on the right-hand side are 1; thus the coefficients on the left-hand side must be too. That means each nonnegative integer appears exactly once as an exponent, i. e. as a sum of distinct powers of two. The fact that one can disguise this combinatorial fact as a fact about functions from C to C -- and then apply the methods of complex analysis, although they're not incredibly useful in this particular case -- is a fascinating example of the interplay between the discrete and the continuous.
and a tattoo of the Y combinator, which is part of this collection of images of science tattoos. Other mathematically inspired tattoos in that collection are:
there exists a unique beth (marred only by the fact that it's not true;- something with a pentagon titled golden ratio tat, a logarithmic spiral, and the Greek letter φ (why is the golden ratio so popular for tattoos?);
- a Mobius strip
- 25
I can think of others. An ex-girlfriend had an infinity symbol tattooed on her (although I believe that was more of a literary thing than a scientific one). A friend of mine has
¬ (p ∧ ¬ p))
tattooed on his leg. A friend of a friend in college had the Taylor series for sine on her arm. It's written out, as
except with exactly enough terms to go once around her arm; it's not in the more compact form
.I don't have any tattoos; I can't think of anything I'd want permanently inked on me. But if I were to get a tattoo, the equation
would be up there. (I had it written on my wall in college.) I've heard it called the "computer scientist's identity"; it's an analytic version of the fact that every positive integer has a unique binary expansion. The left-hand side expands to
(1+z1)(1+z2)(1+z4)(1+z8)...
and you can imagine expanding that out; then you get something like
1 + z1 + z2 + z2+1 + z4 + z4+1 + z4+2 + z4+2+1 + ...
where each sum of distinct powers of two appears as an exponent exactly once. The right-hand side is the geometric series
1/(1-z) = 1 + z + z2 + z3 + ...
and in order for these two expressions to be equal, the coefficient of zn in each of them has to be equal. All the coefficients on the right-hand side are 1; thus the coefficients on the left-hand side must be too. That means each nonnegative integer appears exactly once as an exponent, i. e. as a sum of distinct powers of two. The fact that one can disguise this combinatorial fact as a fact about functions from C to C -- and then apply the methods of complex analysis, although they're not incredibly useful in this particular case -- is a fascinating example of the interplay between the discrete and the continuous.
25 September 2007
A problem of Feynman on parallel computation
Here's a problem from Feynman Lectures on Computation (which, incidentally, I didn't know existed until I was absent-mindedly wandering in the library a few days ago):
The proof is by induction. The base case, when n = 1, is clear -- we can check that two 1-bit numbers are the same in one step. We want to show that if n clerks can do this in time t(n), then 2n clerks can do it in time t(n) + c, where c is a constant. But that's easy -- split each of the two n-bit numbers a and b into half: a = a1a2, b = b1b2. If a1 = b1 AND a2 = b2, return TRUE; otherwise return FALSE. That's just one more time step once you've figured out if a1 = b1 AND a2 = b2.
The picture I get in my head of this situation makes me smile. You need n clerks -- n parallel processors. The kth clerk compares the kth bit of the first number with kth bit of the second number; ey returns a 0 if the two bits are different and a 1 if they're the same. (This is, of course, bitwiseexclusive OR exclusive NOR (thanks Anonymous!).) Then everything pours into a single node which is at the root of a binary tree of depth log2 n.
The next subproblem in Feynman is to add two n-bit numbers in logarithmic time by using such parallel processing. (This is harder because you have to worry about carrying!) Again, it reduces to a problem of combining information on words of one length to words of twice that length -- if you have a = a1a2 (where a1 is the "high", or more significant half, and a2 is the low half), and b = b1b2, what is a+b? Breaking it down into its high half and its low half,
a + b = (a1+b1+c)(a2 + b2)
where c denotes a carry from the addition of a2 and b2, and a2 + b2 denotes addition modulo 2k where k is the length of the summands. We assume a1+b1, c, and a2 + b2 are already known. The problem is... what if a1+b1 ends in a bunch of 1's, and c is 1? We have something like
...0111111 + 1
and we want to add the 1, so we think "okay, I'll just change the last bit in the first summand from 0 to 1"... but it's 1... so you change the last two bits from 01 to 10... but no, that won't work either... so you change the last three bits from 011 to 100...
On average this isn't a problem. On average the number of 1s at the end of a1+b1 is unity.
But not always. Somebody could be deliberately feeding you numbers that are hard to add. Some sort of sadistic grade school teacher.
edited, 10:48 am: Welcome to those of you who came here from reddit. Be aware that I am not a computer scientist -- I'm a mathematician -- so I might not really know what I'm talking about here.
Problem 1.1(c). Most present-day [mid-1980s] computers only have one central processor -- to use our analogy, one clerk. This single file clerk sits there all day long working away like a fiend, taking cards in and out of the store like mad. Ultimately, the speed of the whole machine is determined by the speed at which the clerk -- that is, the central processor -- can do these operations. Let's see how we can maybe improve the machine's performance. Suppose we want to compare two n-bit numbers, where n is a large number like 1024; we want to see if they're the same... [suppose] we can hire n file clerks, or 2n or perhaps 3n; it's up to use to decide how many, but the number must be proportional to n. [How can you get the comparison time to be proportional to log n?]
The proof is by induction. The base case, when n = 1, is clear -- we can check that two 1-bit numbers are the same in one step. We want to show that if n clerks can do this in time t(n), then 2n clerks can do it in time t(n) + c, where c is a constant. But that's easy -- split each of the two n-bit numbers a and b into half: a = a1a2, b = b1b2. If a1 = b1 AND a2 = b2, return TRUE; otherwise return FALSE. That's just one more time step once you've figured out if a1 = b1 AND a2 = b2.
The picture I get in my head of this situation makes me smile. You need n clerks -- n parallel processors. The kth clerk compares the kth bit of the first number with kth bit of the second number; ey returns a 0 if the two bits are different and a 1 if they're the same. (This is, of course, bitwise
The next subproblem in Feynman is to add two n-bit numbers in logarithmic time by using such parallel processing. (This is harder because you have to worry about carrying!) Again, it reduces to a problem of combining information on words of one length to words of twice that length -- if you have a = a1a2 (where a1 is the "high", or more significant half, and a2 is the low half), and b = b1b2, what is a+b? Breaking it down into its high half and its low half,
a + b = (a1+b1+c)(a2 + b2)
where c denotes a carry from the addition of a2 and b2, and a2 + b2 denotes addition modulo 2k where k is the length of the summands. We assume a1+b1, c, and a2 + b2 are already known. The problem is... what if a1+b1 ends in a bunch of 1's, and c is 1? We have something like
...0111111 + 1
and we want to add the 1, so we think "okay, I'll just change the last bit in the first summand from 0 to 1"... but it's 1... so you change the last two bits from 01 to 10... but no, that won't work either... so you change the last three bits from 011 to 100...
On average this isn't a problem. On average the number of 1s at the end of a1+b1 is unity.
But not always. Somebody could be deliberately feeding you numbers that are hard to add. Some sort of sadistic grade school teacher.
edited, 10:48 am: Welcome to those of you who came here from reddit. Be aware that I am not a computer scientist -- I'm a mathematician -- so I might not really know what I'm talking about here.
24 September 2007
redistricting redux
At Statistical Modeling, etc. I learned about Roland Fryer and Richard Holden's Measuring the Compactness of Political Districting Plans, which is a nice mixture of political science and mathematics. (I've talked about redistricting before, here and here.) A nice thing about this paper is that they show their results in an arbitrary metric space -- working in Euclidean space seems kind of limiting because distances in "real life" aren't Euclidean. Sometimes you can't get there from here. Or sometimes you can but no one ever does.
The authors define a "relative proximity index" for a districting plan of a state. First they define an absolute proximity index (they don't use this name, as far as I can see) as the square of the distances between voters, summed over all pairs of voters who are in the same district. Then the relative proximity index is this index measured on a scale where its minimum over all possible districtings of a state is 1. (A districting is a partition of the people in a state into n sets which differ in size by at most 1.)
The main result is that the RPI is an example of a "compactness index", which should satisfy three axioms: anonymity (if you interchange people, the index doesn't change), something called "clustering", and "independence" (which means that a compactness index doesn't vary if the size, population density, or number of districts in a state changes, holding all else constant). It turns out that if one districting plan is better than another under RPI, that relation will also hold under any other compactness index.
This paper also wins the prize for "biggest number I've seen that actually means something". The number of ways to partition the 6,800 census tracts of California into 53 districts is 78.4 × 1059,351. (I was about to write "about 1060,000", despite the fact that these numbers differ by a factor of more than 10647... the fact that I'm willing to throw out such a large factor tells you just how large a number this is!) This is the size of the search spaces they have to consider.
(I don't pretend to understand the details... I've only skimmed the paper.)
23 September 2007
A notion of combinatorial continuity?
My topology professor, a few days ago, pointed out the following fact:
Maps(X, Maps(Y, Z)) = Maps(X × Y, Z)
where "Maps(A, B)" represents the space of continuous functions from A to B with the compact-open topology. He mumbled some words about "adjoint functors" and such to justify this. (I don't remember what the words were; it wasn't particularly important, because I believed it.)
But the "obvious" justification, to me, is just that if Maps represents all functions, then this is obviously true. Consider some black box where you can put in a member x of the set X, and it spits out another black box, which will take a member y of the set Y and spit out a member of the set Z. Why not just stick both x and y in in the first place?
The other notation I've seen used for Maps(X, Y) is YX, which makes sense in a combinatorial context -- YX is the set of sets of elements of Y which are indexed by elements of X. It makes perfect sense when X is finite -- we have
Maps({1,2}, Y) = Y × Y
because in order to specify a function which takes 1 to some element of Y, and 2 to some other element of Y, we just have to name the two elements of Y. And in this notation the original result becomes
(ZY)X = Z(Y × X)
which looks right, because it would be true if those symbols represented integers instead. Or even sets, where we don't care about the continuity. (I'm kind of bothered by the fact that the notation implies continuity, but I can deal with it.)
But that got me thinking -- what would a "combinatorial" version of continuity look like? For concreteness, what is a continuous function from Sn to Sn, where Sn is the symmetric group on n letters? The problem is that there's no natural topology on Sn -- sure, you could use the discrete topology, but then everything's continuous. There's the usual informal characterization of a continuous function that takes things which are close together to things which are close together... but what does "close together" mean here? We could define the distance between two permutations, d(σ, τ) as, say, the number of transpositions needed to get from one to another, and then say f: Sn &rtarrow; Sn is continuous if
d(σ, τ) = 1 implies d(f(σ), f(τ)) ≤ L
for some integer constant L. But this is really more of an analogue of Lipschitz continuity. And what metric is natural?
It seems natural to me to take sets of points in [0,1]n -- the unit n-cube -- and map them to elements of Sn in the "obvious" way, that is, the way which preserves the order relations among the elements of the sequences. So, for example, (0.43, 0.17, 0.94, 0.71, 0.01) is mapepd to (3, 2, 5, 4, 1). Then elements in Sn which differ by a transposition are near each other in the unit n-cube, and we can view a map from Sn to Sn as a map from the unit cube to the unit cube -- although not all maps from the unit cube to the unit cube would project down to maps from Sn to Sn, since what if two points that represent the same permutation map to two points which represent different permutations? But this definition might be too strict for some purposes -- I think it would imply that a continuous function meets the above definition with L = 1.
But I don't have a particular problem in mind; perhaps functions from Sn to Sn, where f(σ) and f(τ) are identical or differ by a transposition whenever σ and τ differ by a transposition, are interesting entities. Perhaps not.
22 September 2007
The fundamental theorem of enumeration, and the Princeton Companion to Mathematics
From Doron Zeilberger's chapter on "Enumerative and Algebraic Combinatorics, to be included in the currently-in-preparation Princeton Companion to Mathematics
Sounds kind of silly, but it's true. The whole chapter is a nice fourteen-page answer to "what is enumerative combinatorics?", mentioning most of the classic problems and most common methods of solution, which appears to be its raison d'être; I know most of this stuff but I can imagine how useful similar blurbs on subjects I'm not so familiar with would be, and indeed most of the book is intended to be at about the first-year undergraduate level; that's low enough that I should be able to read it without stopping for breath. (The guidelines for contributors say that the articles about various subjects should be something like the beginning of a very good colloquium talk, the sort where you really get the feeling that you know something about how some other area of mathematics works.) The PCM has a semi-official blog, which is Tim Gowers' blog. Several dozen of the component articles are available online, on a password-protected site; the password is in the linked-to post by Gowers. I suspect I'll have more to say about the PCM in the future.
"The fundamental theorem of enumeration, independently discovered by several anonymous cave dwellers, states that
|A| = Σa∈A 1.
In words: the number of elements of A is the sum over all elements of A of the constant function 1."
Sounds kind of silly, but it's true. The whole chapter is a nice fourteen-page answer to "what is enumerative combinatorics?", mentioning most of the classic problems and most common methods of solution, which appears to be its raison d'être; I know most of this stuff but I can imagine how useful similar blurbs on subjects I'm not so familiar with would be, and indeed most of the book is intended to be at about the first-year undergraduate level; that's low enough that I should be able to read it without stopping for breath. (The guidelines for contributors say that the articles about various subjects should be something like the beginning of a very good colloquium talk, the sort where you really get the feeling that you know something about how some other area of mathematics works.) The PCM has a semi-official blog, which is Tim Gowers' blog. Several dozen of the component articles are available online, on a password-protected site; the password is in the linked-to post by Gowers. I suspect I'll have more to say about the PCM in the future.
Some thoughts on coordinate systems
I'm teaching multivariate calculus this term. The course, as it's taught here, begins with a unit on geometry in three dimensions; here we introduce cylindrical and spherical coordinates. (I'm not entirely convinced that they should be introduced at the point they are, because basically all we can ask the students to do is to convert between the various coordinate systems, but my hands are tied. It almost seems to make more sense to wait to teach the coordinates until we get to the point where we're doing integrals over regions that are best expressed in cylindrical or spherical coordinates.)
Anyway, a student e-mailed me a question today. One problem on the homework was to find equations in cylindrical and spherical coordinates for x2 + y2 + z2 + 2z = 0. In cylindrical coordinates, (where x2 + y2 = r2 this becomes r2 + z2 + 2z = 0. (My aesthetic sense is that this is perhaps better written as r2 + (z+1)2 = 1, because then it's immediately obvious that there are in fact solutions to the equation.) She asked if it was acceptable to leave it in one of these forms, or if it needed to be converted to, say, something with z in terms of r and θ (which would involve square roots).
I responded as follows:
"Takes the least writing" is admittedly a bit sloppy here; how does one define it? The amount of "writing" any mathematical expression takes depends on one's notation. For example, subscripts or superscripts take up a lot of keystrokes in HTML, not so many in TeX (which is of course optimized for mathematical writing), and if one is writing by hand writing a subscript is just one character. (Indeed, one could even argue that subscripts and superscripts require less writing than full-size characters in handwriting -- they take less ink! But I shudder at the thought of taking this to its logical conclusion.)
Another principle I might invoke is "symmetry" -- another reason the equation about for a sphere looks wrong is because it fails to capture the fact that x, y, and z all behave "the same way". The form x2 + y2 + z2, on the other hand, doesn't have this problem. But I think "symmetry" might not be so useful a concept when trying to teach students; the ones who will understand this rather vague idea are the same ones who would probably just give the equation in a "more symmetric" form even if I didn't tell them to.
And why do cylindrical coordinates not seem to have a "dependent" and an "independent" variable, whereas three-dimensional Cartesian and spherical coordinates do? (I admit that this might just be my intuition, and I don't know if this agrees with anyone else's intuition.)
Anyway, a student e-mailed me a question today. One problem on the homework was to find equations in cylindrical and spherical coordinates for x2 + y2 + z2 + 2z = 0. In cylindrical coordinates, (where x2 + y2 = r2 this becomes r2 + z2 + 2z = 0. (My aesthetic sense is that this is perhaps better written as r2 + (z+1)2 = 1, because then it's immediately obvious that there are in fact solutions to the equation.) She asked if it was acceptable to leave it in one of these forms, or if it needed to be converted to, say, something with z in terms of r and θ (which would involve square roots).
I responded as follows:
In rectangular coordinates it might be preferable to solve for z in terms of x and y if it's possible to do so without making things too ugly, since we have a tendency to think of surfaces given in Cartesian coordinates as a "graph" of a function of x and y. The same thing is sort of true in spherical coordinates, in that ρ is often seen as a function of θ and φ (This is like polar coordinates, where r is usually a function of θ.) In cylindrical coordinates, though, none of the three coordinates really seem to be "dependent" or "independent".
Of course, all these rules can be violated; for example, one would never write the equation of a unit sphere centered at the origin as
z = ± (1-x2-y2)1/2
unless it were to graph it on a system that can't handle implicitly defined surfaces. The guiding principle should be that you want the simplest equation possible, i. e. the one which takes the least writing.
"Takes the least writing" is admittedly a bit sloppy here; how does one define it? The amount of "writing" any mathematical expression takes depends on one's notation. For example, subscripts or superscripts take up a lot of keystrokes in HTML, not so many in TeX (which is of course optimized for mathematical writing), and if one is writing by hand writing a subscript is just one character. (Indeed, one could even argue that subscripts and superscripts require less writing than full-size characters in handwriting -- they take less ink! But I shudder at the thought of taking this to its logical conclusion.)
Another principle I might invoke is "symmetry" -- another reason the equation about for a sphere looks wrong is because it fails to capture the fact that x, y, and z all behave "the same way". The form x2 + y2 + z2, on the other hand, doesn't have this problem. But I think "symmetry" might not be so useful a concept when trying to teach students; the ones who will understand this rather vague idea are the same ones who would probably just give the equation in a "more symmetric" form even if I didn't tell them to.
And why do cylindrical coordinates not seem to have a "dependent" and an "independent" variable, whereas three-dimensional Cartesian and spherical coordinates do? (I admit that this might just be my intuition, and I don't know if this agrees with anyone else's intuition.)
21 September 2007
The NYT archives on Fermat's Last Theorem
As you may know, the New York Times has opened up its online archives. Thus, I bring you:
June 24, 1993: At Last, Shout of 'Eureka!' In Age-Old Math Mystery by Gina Kolata.
(Note that the NYT doesn't seem to render superscripts correctly; I trust this won't be a problem for you!) They're interesting articles, but they don't say anything that hasn't been rehashed a zillion times in the last fourteen years; I bring them up mostly as historical curiosities.
From the June 24 article:
A column by James Gleick from October of 1993, which includes the following:
I don't know about that. Fermat's Last Theorem somehow seems accidental, even though it's so simple, and it's not used to prove other results. It wouldn't have nearly the same renown if Fermat hadn't scribbled that note in the margin. It's a "cute" problem, nothing more, one that's become important by historical accident. Gleick points out that whole branches of mathematics have arisen from failed attempts to solve FLT -- but wouldn't they have arisen in some other way? It's important to have big unsolved problems that will inspire people. But I don't know if it matters what problems, exactly, they are. If there are alien mathematicians, I wouldn't be surprised if to them FLT is just a footnote, if they've actually proved it at all. (I think they'll have at least thought of the problem, though, because the Pythagorean theorem seems inevitable, and any mathematical community that never thinks to attempt the generalization to higher exponents isn't a mathematical community worthy of the name.)
But if the Riemann Hypothesis turns out to be true (and I don't doubt that it is) I'd put it above Fermat's Last Theorem on such a list. (Not for the form in terms of the zeta function, but in one of the equivalent forms in terms of strengthenngs of the Prime Number Theorem.)
Also from the Gleick column:
Here are some other things dragged out of the archives:
June 27, 1993: But How Did Fermat Do It?
June 27, 1993: After 350 Years, A "Q. E. D." (This is a very short item; it appears to be from some sort of "week in review".
June 29, 1993: SCIENTIST AT WORK: Andrew Wiles; Math Whiz Who Battled 350-Year-Old Problem by Gina Kolata.
A review of Amir Aczel's book "Fermat's Last Theorem"
And a challenge: find the error in this "parody proof" of FLT, which I found from the Wikipedia article. (I don't think this is particularly difficult. But I'm lazy, so I want you to tell me what it is.)
I think I'll stop here.
June 24, 1993: At Last, Shout of 'Eureka!' In Age-Old Math Mystery by Gina Kolata.
(Note that the NYT doesn't seem to render superscripts correctly; I trust this won't be a problem for you!) They're interesting articles, but they don't say anything that hasn't been rehashed a zillion times in the last fourteen years; I bring them up mostly as historical curiosities.
From the June 24 article:
Dr. Ribet said that 20th-century work on the problem had begun to grow ever more divorced from Fermat's equations. "Over the last 60 years, people in number theory have forged an incredible number of tools to deal with simple problems like this," he said. Eventually, "people lost day-to-day contact with the old problems and were preoccupied with the objects they created," he said.I've definitely had this feeling about number theory before; a lot of what goes under the name "number theory" doesn't seem to have all that much to do with, well, numbers: 1, 2, 3, 4, and so on. Somehow understanding the structure of those numbers seems more important to me, in some aesthetic sense, than understanding the structure of some crazy set of "numbers" one invents; should these auxiliary structures be anything more than scaffolding? Perhaps this is why I'm not a number theorist.
A column by James Gleick from October of 1993, which includes the following:
What a peculiar bit of knowledge! Yet if anyone is out there judging the galaxy's civilizations according to some handbook of "What Every Bright Species Ought to Know," it seems reasonable to suppose that somewhere on the list will be the fact of arithmetic that we call Fermat's Last Theorem. It must be a universal truth -- true here, true everywhere, true now, true always.
I don't know about that. Fermat's Last Theorem somehow seems accidental, even though it's so simple, and it's not used to prove other results. It wouldn't have nearly the same renown if Fermat hadn't scribbled that note in the margin. It's a "cute" problem, nothing more, one that's become important by historical accident. Gleick points out that whole branches of mathematics have arisen from failed attempts to solve FLT -- but wouldn't they have arisen in some other way? It's important to have big unsolved problems that will inspire people. But I don't know if it matters what problems, exactly, they are. If there are alien mathematicians, I wouldn't be surprised if to them FLT is just a footnote, if they've actually proved it at all. (I think they'll have at least thought of the problem, though, because the Pythagorean theorem seems inevitable, and any mathematical community that never thinks to attempt the generalization to higher exponents isn't a mathematical community worthy of the name.)
But if the Riemann Hypothesis turns out to be true (and I don't doubt that it is) I'd put it above Fermat's Last Theorem on such a list. (Not for the form in terms of the zeta function, but in one of the equivalent forms in terms of strengthenngs of the Prime Number Theorem.)
Also from the Gleick column:
It's an impressively economical way of speaking, really -- a picture's-worth-a-thousand-words approach wherein one word is worth a thousand words. Never mind that the published version of Wiles's proof will run 200 pages. To expand the shorthand, flesh it out so that, say, Fermat could understand it, would require many times more.That's an interesting point. I've heard it claimed that the true "difficulty" of a piece of mathematics is not its length, but the length of all the pieces of mathematics that had to come before it. And perhaps if we couldn't explain it to Fermat, that means we don't really understand it. Feynman said, when he was teaching the courses that became the Feynman Lectures on Physics, that if he couldn't express something in a way that could be understood by freshmen, it meant he didn't really understand it. Fermat, one might say, could be considered one of these freshmen.
Here are some other things dragged out of the archives:
June 27, 1993: But How Did Fermat Do It?
June 27, 1993: After 350 Years, A "Q. E. D." (This is a very short item; it appears to be from some sort of "week in review".
June 29, 1993: SCIENTIST AT WORK: Andrew Wiles; Math Whiz Who Battled 350-Year-Old Problem by Gina Kolata.
A review of Amir Aczel's book "Fermat's Last Theorem"
And a challenge: find the error in this "parody proof" of FLT, which I found from the Wikipedia article. (I don't think this is particularly difficult. But I'm lazy, so I want you to tell me what it is.)
I think I'll stop here.
20 September 2007
Baseball entropy
I was thinking of putting together a prediction of the Phillies' odds of making the postseason -- it's late enough in the season that I can do the calculations exactly, if I'm willing to ignore the teams that plainly have no chance -- but the results would be depressing. (Although I did do a prediction of the Phillies' ten-thousandth loss, which came a couple days earlier than I predicted. That was depressing, too.) The good folks at Baseball Prospectus do a simulation where they run the rest of the season a million times; at this time of the season, with ten games left, the odds fluctuate wildly with each game.
I've also wondered if it would be possible to determine some sort of information entropy (the link goes to a nice intuitive explanation of what that means) from these postseason odds, and use that as a single quantity to determine how "close" the playoff races are at a given moment. For example, at basically any moment this season, the National League has been "closer" than the American League. Okay, by "wondered" I mean I thought "I don't really want to do the computations, because I'm lazy". The information entropy explains "how surprising" a random variable is. The entropy of a random variable which takes each of n values 1, ..., n with probabilities p1, ..., pn is
-(p1 log p1 + ... + pn log pn)
where we adopt the convention that 0 log 0 = 0 (or, equivalently, we say that all the probabilites involved are nonzero.) For example, consider the winner of this year's National League pennant. If there are, say, three known playoff teams and a fourth team which is equally likely to be one of two teams, then the probability that the pennant winner is any of the first three teams is 1/4, and any of the other two teams 1/2; then the entropy of that random variable is
3 (1/4 log 4) + 2 (1/8 log 8) = 9/4
(logs are base 2 here; this means that entropy is measured in bits). The entropy of a random variable which is equally likely to take any of n values is log n bits; thus there are in some sense 29/4 = 4.756... contenders, in that if we could have a random variable which took 29/4 values with equal probability, it would have the same entropy. This interpolates between four and five; there are five contenders but three of them are clearly stronger than the other two. As of right now the probabilities of each National League team making the playoffs, according to Baseball Prospectus, are
.9449017 (Mets), .8990023 (Diamondbacks), .8109878 (Padres), .7179337 (Cubs), .2938922 (Phillies), .2825803 (Brewers), .0310565 (Rockies), .0106489 (Dodgers), .0089891 (Braves), .0000075 (Cardinals), all other teams zero
I'll assume that each of these teams, if they should make the playoffs, have a one-in-four chance of winning the pennant; thus the entropy of the pennant winner is given by summing a bunch of terms which look like
-.9449017/4 log (.9449017/4)
and in the end we get 2.5312 bits, corresponding to 22.5312 = 5.780 contenders. This seems reasonable; there are basically six contending teams at this point.
The American League has four teams above 99 percent right now (Red Sox, Yankees, Indians, Angels), and the entropy of their pennant winner is 2.019 bits or 4.054 "effective" contenders.
And this post was originally supposed to be about math humor in a baseball radio broadcast: Ryan Howard, with the bases empty, has fourteen home runs and fourteen RBIs so far this season.
I was just (well, a couple innings ago now) informed of this by the Phillies radio announcers; it appeared on the monitor that tells them the statistics.
They chuckled at this. I assume they were chuckling because it's trivial, as one of them said "well, how many RBIs was he supposed to have?" The only way one can bat in a run if the bases are empty is to hit a home run; furthermore that will bat in exactly one run.
(I assume that the monitor in question breaks down a player's statistics by the eight possible situations for who is on the bases; the other lines probably seem less silly. They won't show this same sort of thing, because when runners are on base it's possible to get them in without scoring a home run.)
Broccoli causes lung cancer, or why most science is wrong
Robert Lee Hotz wrote in the Wall Street Journal that most science studies appear to be tainted by sloppy analysis. (My impression here is that "science" means "biomedical science", which is the sort of science that is most reported on by the media, for the simple reason that it is the kind of science which has the most direct effect on people's lives.) I learned about this from Marginal Revolution; NeuroLogica and denialism have picked it up as well; this is all based on some grand meta-analysis by John Ioannidis.
I'd like to share with you an example I made up a few days ago, while I was randomly pontificating. Imagine that for some reason, scientists suspect that there is a link between broccoli and lung cancer. One hundred scientists do one hundred separate studies trying to find this link. Three of them say "there appears to be a positive correlation between broccoli and lung cancer", meaning that they found such a correlation and that it is outside a 95% confidence interval. The media will hear this and will say "look! broccoli causes lung cancer!" and the broccoli industry will be very unhappy. (The elder George Bush will be happy, though.) But if there were no correlation, you'd expect five of the hundred scientists to have found this correlation just by sheer luck! The fact that only three of them found it is evidence towards broccoli not causing lung cancer.
But you'll never hear that on the evening news, because the news people want you to think you're sick, or you're going to get sick. Their audience is aging and their main advertisers are drug companies.
A slightly less toy example can be found in an old Marginal Revolution post.
A bit more seriously, it seems like a lot of people are tinkering with their data too much:
But one in twenty things that are "neither true nor false" will appear true. Perhaps it makes sense to require a wider confidence interval for results which are obtained by this sort of "data mining" than for the results which one originally intended to find? It's turning out that a lot of results are not reproducible.
Although I don't presume to be qualified to speak for how medical researchers should do their work, it seems to me that perhaps they need more forums to report negative results. In the broccoli-and-lung-cancer example, I suspect that the researchers publishing the three papers with positive results wouldn't know about enough of the negative results to make them doubt their claim. As Steven Novella points out, the fact that "most published research is wrong" is probably a combination of this lack of such forums and something like my example.
There are growing suggestions that this would even be useful in mathematics, where you'd think we wouldn't need it because we can prove our results beyond a shadow of a doubt. But we don't publicize our negative results -- we don't publish papers saying "I thought proposition X might be true, and here's why, but then I came up with this counterexample", although we might say these things in informal conversation. So there's still probably a tremendous duplication of work. Some duplication of work is probably desirable, even in mathematics; different people will have different perspectives on the same problem. But a lot of people probably have the sense that they are going down an already-explored dead end and it would be nice if they had at least some ability to confirm or refute that. This can only be more important when we're talking about the sort of research where lives are at stake.
I'd like to share with you an example I made up a few days ago, while I was randomly pontificating. Imagine that for some reason, scientists suspect that there is a link between broccoli and lung cancer. One hundred scientists do one hundred separate studies trying to find this link. Three of them say "there appears to be a positive correlation between broccoli and lung cancer", meaning that they found such a correlation and that it is outside a 95% confidence interval. The media will hear this and will say "look! broccoli causes lung cancer!" and the broccoli industry will be very unhappy. (The elder George Bush will be happy, though.) But if there were no correlation, you'd expect five of the hundred scientists to have found this correlation just by sheer luck! The fact that only three of them found it is evidence towards broccoli not causing lung cancer.
But you'll never hear that on the evening news, because the news people want you to think you're sick, or you're going to get sick. Their audience is aging and their main advertisers are drug companies.
A slightly less toy example can be found in an old Marginal Revolution post.
A bit more seriously, it seems like a lot of people are tinkering with their data too much:
Statistically speaking, science suffers from an excess of significance. Overeager researchers often tinker too much with the statistical variables of their analysis to coax any meaningful insight from their data sets. "People are messing around with the data to find anything that seems significant, to show they have found something that is new and unusual," Dr. Ioannidis said.
But one in twenty things that are "neither true nor false" will appear true. Perhaps it makes sense to require a wider confidence interval for results which are obtained by this sort of "data mining" than for the results which one originally intended to find? It's turning out that a lot of results are not reproducible.
Although I don't presume to be qualified to speak for how medical researchers should do their work, it seems to me that perhaps they need more forums to report negative results. In the broccoli-and-lung-cancer example, I suspect that the researchers publishing the three papers with positive results wouldn't know about enough of the negative results to make them doubt their claim. As Steven Novella points out, the fact that "most published research is wrong" is probably a combination of this lack of such forums and something like my example.
There are growing suggestions that this would even be useful in mathematics, where you'd think we wouldn't need it because we can prove our results beyond a shadow of a doubt. But we don't publicize our negative results -- we don't publish papers saying "I thought proposition X might be true, and here's why, but then I came up with this counterexample", although we might say these things in informal conversation. So there's still probably a tremendous duplication of work. Some duplication of work is probably desirable, even in mathematics; different people will have different perspectives on the same problem. But a lot of people probably have the sense that they are going down an already-explored dead end and it would be nice if they had at least some ability to confirm or refute that. This can only be more important when we're talking about the sort of research where lives are at stake.
19 September 2007
A quick thought on Newton's method
John Armstrong talks about fractals in Newton's method. (If you're not familiar with Newton's method, read that post first; what follows is in the nature of a comment to it.) This is something you wouldn't expect; when you're taught Newton's method the impression is that it'll always find the closest root to your initial estimate, or at least that the region which eventually leads to any given root is "nice-looking". That is very far from being true. Basically, if you're trying to find a zero of f(z) using Newton's method, and f'(z) is small, then you can suddenly find yourself making arbitrarily large steps. The self-similar nature of the picture you get if you color the initial values which lead to one zero red, another zero green, another zero blue, and so on isn't too surprising if you think about it this way; the picture has to be its own image under the transformation which takes c to c-(f'(c)/f(c)), which is analytic when f(c) isn't zero. An example of such a picture accompanies the post.
A heuristic look at the crossing number inequality
Terence Tao gives a (well-known) proof of the crossing number inequality. This inequality states that for a graph of average degree at least eight,
cr(G) ≥ E3/(64V2)
where V is the number of vertices of G, E is the number of edges of G, and cr(G) is the so-called "crossing number" -- the minimum number of crossings of edges in a drawing of the graph. (As is usual in the "probabilistic method", a fairly simple proof gets the same form as the best known proof but with weaker constants; a paper of Pach, Radiocic, Rados, Tardos, and Gabor1 improves the constant to 31.08. (From a quick skim through the paper, it doesn't look too interesting, being mostly a bunch of messy computations.)
Why should the crossing number inequality have these exponents? Say that we expect a lower bound for cr(G) of the form cEαVβ. (We have this, with c = 1/64, α = 3, β = -2.)
Say we replace G with two copies of G. Then we double its number of edges, its number of vertices, and its number of crossings. Our proposed lower bound now becomes c(2E)α(2V)β, and we'd like this to equal twice the old bound. So we have
cEαVβ = c(2E)α(2V)β
and canceling what will cancel, we get α + β = 1. (Of course, this is all technically wrong, because I've been adding inequalities like they're equalities.) So if we can guess what either α or β will be, we win! (What do we win? A cup of bad coffee. Please go to any mathematics department to claim your prize.)
So now let's say we double the number of edges in a graph; we want to know why this should multiply the number of crossings by 23 = 8. This seems not so promising. Imagine two graphs on the same vertex set, G and G', which we've smushed together to make a new graph. There is some number of crossings among edges of G, and some number among edges of G'; we want the total nubmer of crossings on this new graph to be eight times the number on either of the original graphs. So the number of crossings involving an edge of G and an edge of G' must be six times the crossing number of G or G'; this might be true but seems hopeless. (Throwing three graphs on top of each other only makes it worse; now we need twenty-seven times as many crossings on G + G' + G'' as we would on any of the three summands, and so we'll have to get eight times cr(G) crossings from each pair of summands. It only gets worse with more summands.
Okay... here's another idea. Hold V constant. Then the inequality says that the crossing number is at least proportional to the cube of the number of edges. This is strange, as it seems to imply somehow that a crossing is going to involve three edges. But now think about how many potential crossings there are in a graph with E edges. These are just pairs of edges, so there are about E2/2 of them. So the inequality is just saying that the probability of two edges crossing in a graph is proportional to the total number of edges!
But what makes things cross? Well, edges that are long are more likely to cross than edges that are short. (It's like how you find yourself maneuvering around fat people on the sidewalk, but not skinny people.) In particular, if we have two curves of length l1 and l2, their probability of crossing -- assuming they move around "randomly" -- will be proportional to the product of their lengths. But how long are the edges in a drawing of a graph? In order to minimize crossings, we probably want edges which are connected to be near each other. And the vertices are probably "evenly spaced" in the plane; say each one has an area of order 1 that is closer to it than to any other vertex. Let d = 2E/V be the average degree of our graph; then the optimal drawing of a graph should have the edges connected to any given vertex v within a circle of area ~d around that vertex... or a circle of radius ~d1/2. Thus edge length is proportional to the square root of the average degree... and the probability of two edges crossing is proportional to the square of average edge length. So the probability of two edges crossing is proportional to average degree, which if we're holding V constant is proportional to the number of edges.
Just like we wanted.
Of course, there are a lot of places where this argument doesn't make sense; in particular I feel a bit wrong about my argument for the probability of random curves crossing being proportional to the product of their lengths. But it's still how I will understand why this result is true.
(There is a way to reinterpret the crossing number inequality, if for some reason that V in the denominator bothers you, as it did me at first We can interpret it in terms of the average degree d of a graph G, which is just 2E/V. Then we have
cr(G) ≥ Ed2/256
and this form seems clearer to me. Crossing number increases linearly with number of edges, which makes perfect sense -- if you take two disjoint copies of a graph, they each have the same number of crossings, so the total number of crossings should be twice what you started with. And it increases with the square of the average degree. None of this silly stuff with the number of vertices in the denominator. The problem with this, as I discovered, is that the average degree depends on the number of edges...)
1. Pach, János; Radoi\v ci\'c, Rado\v s; Tardos, Gábor; Tóth, Géza Improving the crossing lemma by finding more crossings in sparse graphs. Discrete Comput. Geom. 36 (2006), no. 4, 527--552. Available from Tardos' web site at http://www.renyi.hu/~tardos/crossinglemma.ps.
18 September 2007
how to categorize mathematicians, part N
Andrew at Statistical Modeling, etc. talks about the hedgehog-fox distinction (also here). The idea is that scientists of whatever type can be divided into "hedgehogs" and "foxes", with the "hedgehogs" being those who work on one problem and the "foxes", those who work on many. Andrew claims that statisicians, for the most part, are "foxes". (I can't intelligibly comment on this because in order to do so one has to have a sense of which results come from which people, which I don't in that field.)
There's a similar distinction that some people make in mathematics between people who prove lots of facts and people who produce an overarching theory that unites those facts. Any discipline needs both, I think. In physics one hears the metaphor of experiment and theory "leapfrogging" each other; the theory suggests new experimental approaches, which eventually push the boundaries of the existing theory, which lead theorists to come up with new theory which explains the new experimental results, and so on. The distinction exists in mathematics, too, although it's a little harder to see because what the "theoretical" mathematicians do and what the "experimental" mathematicians do look superficially similar. They both involve lots of staring off into space and occasionally scribbling illegibly on a piece of paper.
But this isn't exactly the same distinction. A mathematical "hedgehog" could, for example, work on solving a few "problems" which happen to be very hard; a "fox" could theorize and systematize in a bunch of different areas. This is perhaps made difficult by the fact that although it's easy to do a problem in an area not one's own, it's harder to pull together many problems in an area not one's own to make a theory without taking a long time to understand the large set of disconnected problems that have been done well enough to see the underlying structure.
Timothy Gowers has talked about the distinction between problem solvers and theorizers in his essay The Two Cultures of Mathematics (via the n-Category Cafe). Gowers also gives some examples of "organizing principles" of combinatorics; a lot of his examples would be difficult to write as "theorems", but are more in the nature of "tricks that work an awful lot of the time":
Were other areas that now appear to have some sort of big overarching theory like this in the past? Is combinatorics only like this because it's relatively young, or is this a fundamental trait of this part of the mathematical universe?
There's a similar distinction that some people make in mathematics between people who prove lots of facts and people who produce an overarching theory that unites those facts. Any discipline needs both, I think. In physics one hears the metaphor of experiment and theory "leapfrogging" each other; the theory suggests new experimental approaches, which eventually push the boundaries of the existing theory, which lead theorists to come up with new theory which explains the new experimental results, and so on. The distinction exists in mathematics, too, although it's a little harder to see because what the "theoretical" mathematicians do and what the "experimental" mathematicians do look superficially similar. They both involve lots of staring off into space and occasionally scribbling illegibly on a piece of paper.
But this isn't exactly the same distinction. A mathematical "hedgehog" could, for example, work on solving a few "problems" which happen to be very hard; a "fox" could theorize and systematize in a bunch of different areas. This is perhaps made difficult by the fact that although it's easy to do a problem in an area not one's own, it's harder to pull together many problems in an area not one's own to make a theory without taking a long time to understand the large set of disconnected problems that have been done well enough to see the underlying structure.
Timothy Gowers has talked about the distinction between problem solvers and theorizers in his essay The Two Cultures of Mathematics (via the n-Category Cafe). Gowers also gives some examples of "organizing principles" of combinatorics; a lot of his examples would be difficult to write as "theorems", but are more in the nature of "tricks that work an awful lot of the time":
I have been trying to counter the suggestion that the subject of combinatorics has very little structure and consists of nothing more than a very large number of problems. While the structure is less obvious than it is in many other subjects, it is there in the form of somewhat vague general statements that allow proofs to be condensed in the mind, and therefore more easily memorized and more easily transmitted to others.
Were other areas that now appear to have some sort of big overarching theory like this in the past? Is combinatorics only like this because it's relatively young, or is this a fundamental trait of this part of the mathematical universe?
A convention for quadrant/octant/orthant numbering
In two-dimensional Cartesian geometry, it's conventional to refer to the area where x and y are both positive as the "first quadrant", to that where x is negative and y is positive as the "second quadrant", to that where y is negative and x is negative as the "third quadrant", and to that where y is negative and x is positive as the "fourth quadrant". In tabular form, we have
There seems to be no conventional way to extend this to the eight octants in three-dimensional Cartesian geometry. The only thing that people seem to do consistently is to call the octant where x, y, and z are all positive the "first octant", or sometimes the "positive octant". And I've noticed that a few of my students want to call the octant where x, y, and z are all negative the "eighth octant"; I actually want to do the same. It's far from the first octant; it should have a number that is far from 1. But we don't call the quadrant where x and y are negative the "fourth quadrant".
Actually, the "next step" in this recursion would lead to a scheme in which the (-, -, -) octant is called the fifth octant, and in general the octant obtained by reflecting the nth octant over the xy-plane "should be" (9-n)th octant. This preserves the property that the kth octant and the (k+1)st octant are adjacent; there's no a priori reason why this is a good condition to have, but it's the same recurstion that says that the 3rd and 4th quadrants are obtained by reflecting the 2nd and 1st quadrants, respectively, over the x-axis.
More generally, in d+1 dimensions, the point (ε1, ε2, ..., εd, 1), where each ε is ±1, is in the (d+1)-dimensional orthant with the same number as the d-dimensional orthant containing (ε1, ε2, ..., εd); call this number k. The point (ε1, ε2, ..., εd, -1) is in the orthant with number (2d+1+1-k).
This means that if we traverse the octants (or, more generally, the "orthants" in d-dimensional space) in numerical order, we get a Hamiltonian tour of the vertices of the d-dimensional cube, which is kind of cute.
This page from Math Forum seems to advocate calling the all-negative octant the "seventh octant", which comes from a hybrid of my convention and the convention that octants which border each other over the plane z=0 have numbers differeing by 4. I suppose it's okay in three dimensions, but my sense of aesthetics demands that we have a definition which recurses to higher dimensions.
Still, there's really no reason to be able to number the orthants other than the all-positive one (often called the "first orthant"), and anyone who needs to refer to a particular orthant really ought to just specify it in the form x1 * 0, x2 * 0, ... where each * is < or > in order to avoid confusion.
| x < 0 | x > 0 | |
| y > 0 | 2nd | 1st |
| y < 0 | 3rd | 4th |
There seems to be no conventional way to extend this to the eight octants in three-dimensional Cartesian geometry. The only thing that people seem to do consistently is to call the octant where x, y, and z are all positive the "first octant", or sometimes the "positive octant". And I've noticed that a few of my students want to call the octant where x, y, and z are all negative the "eighth octant"; I actually want to do the same. It's far from the first octant; it should have a number that is far from 1. But we don't call the quadrant where x and y are negative the "fourth quadrant".
Actually, the "next step" in this recursion would lead to a scheme in which the (-, -, -) octant is called the fifth octant, and in general the octant obtained by reflecting the nth octant over the xy-plane "should be" (9-n)th octant. This preserves the property that the kth octant and the (k+1)st octant are adjacent; there's no a priori reason why this is a good condition to have, but it's the same recurstion that says that the 3rd and 4th quadrants are obtained by reflecting the 2nd and 1st quadrants, respectively, over the x-axis.
More generally, in d+1 dimensions, the point (ε1, ε2, ..., εd, 1), where each ε is ±1, is in the (d+1)-dimensional orthant with the same number as the d-dimensional orthant containing (ε1, ε2, ..., εd); call this number k. The point (ε1, ε2, ..., εd, -1) is in the orthant with number (2d+1+1-k).
This means that if we traverse the octants (or, more generally, the "orthants" in d-dimensional space) in numerical order, we get a Hamiltonian tour of the vertices of the d-dimensional cube, which is kind of cute.
This page from Math Forum seems to advocate calling the all-negative octant the "seventh octant", which comes from a hybrid of my convention and the convention that octants which border each other over the plane z=0 have numbers differeing by 4. I suppose it's okay in three dimensions, but my sense of aesthetics demands that we have a definition which recurses to higher dimensions.
Still, there's really no reason to be able to number the orthants other than the all-positive one (often called the "first orthant"), and anyone who needs to refer to a particular orthant really ought to just specify it in the form x1 * 0, x2 * 0, ... where each * is < or > in order to avoid confusion.
A cultural map of the world
Take a look at the Inglehart-Welzel Cultural Map of the World:
The resulting "map" doesn't resemble any "traditional" map of the world, but it's interesting. For example, all the English-speaking countries end up near each other, all the countries of Protestant Europe end up near each other, and so on.
I'm not sure why "English-speaking" is its own group, while no other language is given its own group. In particular, all the Spanish-and-Portuguese-speaking countries seem to end up together. (This is obscured by the map, which for some strange reason includes Uruguay in "Catholic Europe" and Portugal in "Latin America". I'm conflating Spanish and Portuguese not because I don't know there's a difference, but because they are fairly similar as languages go.
My instinct is that the "Traditional Values"/"Secular-Rational Values" divide is similar to the ideological conservative/liberal divide in American politics (although I'm not sure how this would be made precise); I want to say that the "Survival Values"/"Self-Expression Values" dimension corresponds to the economic conservative/liberal divide in American politics although that seems like a lot more of a stretch. Apparently countries seem to move from "Survival" to "Self-Expression" (i. e. rightward on the graph) with time.
One sees a lot of these "factor analysis" plots where a large-dimensional space is reduced to just two dimensions in this way; I don't think there's some fundamental reason why two dimensions is the natural way to think about this, but rather that we're just good at drawing two-dimensional pictures. Dave Rusin's Mathematical Atlas includes such a plot (although naming the dimensions is tricky -- I thought they might be discrete vs. continuous and pure vs. applied.) I've also seen a political map like this, based on the voting records of U. S. Senators and Representatives; it's kind of fascinating to watch how the two parties have moved around with time, and how you can explain almost as much variation between politicians by just looking at a single variable as you used to need two variables for. You can almost predict who will vote for a given bill just by lining up the Senators from "most liberal" to "most conservative" and drawing a line somewhere to separate the two sides. Life is more complicated than that.
I wonder if one could use a plot like this (or the data which underlies it) to predict which international borders are likely to create a lot of tension. For example, the U. S. is (according to this plot) much more similar to Canada than it is to Mexico, and there seems to be a lot more tension at the U. S.'s southern border than at its northern one. Perhaps one could predict strife within a country as well, if a survey like this was done for subnational entities. Lumping the entire United States together seems almost ludicrous to me.
Also, how is this sort of thing correlated with language? And if the language spoken in a country changes, for whatever reason, is this correlated with that country becoming more like countries that speak the new language? It seems reasonable that there should be some connection between language and culture, if only because most of culture is expressed through language. But causation is a problem; do countries become more like each other because they speak the same language, or do countries that speak the same language become more like each other?
The World Values Surveys were designed to provide a comprehensive measurement of all major areas of human concern, from religion to politics to economic and social life and two dimensions dominate the picture: (1) Traditional/ Secular-rational and (2) Survival/Self-expression values. These two dimensions explain more than 70 percent of the cross-national variance in a factor analysis of ten indicators-and each of these dimensions is strongly correlated with scores of other important orientations.
The resulting "map" doesn't resemble any "traditional" map of the world, but it's interesting. For example, all the English-speaking countries end up near each other, all the countries of Protestant Europe end up near each other, and so on.
I'm not sure why "English-speaking" is its own group, while no other language is given its own group. In particular, all the Spanish-and-Portuguese-speaking countries seem to end up together. (This is obscured by the map, which for some strange reason includes Uruguay in "Catholic Europe" and Portugal in "Latin America". I'm conflating Spanish and Portuguese not because I don't know there's a difference, but because they are fairly similar as languages go.
My instinct is that the "Traditional Values"/"Secular-Rational Values" divide is similar to the ideological conservative/liberal divide in American politics (although I'm not sure how this would be made precise); I want to say that the "Survival Values"/"Self-Expression Values" dimension corresponds to the economic conservative/liberal divide in American politics although that seems like a lot more of a stretch. Apparently countries seem to move from "Survival" to "Self-Expression" (i. e. rightward on the graph) with time.
One sees a lot of these "factor analysis" plots where a large-dimensional space is reduced to just two dimensions in this way; I don't think there's some fundamental reason why two dimensions is the natural way to think about this, but rather that we're just good at drawing two-dimensional pictures. Dave Rusin's Mathematical Atlas includes such a plot (although naming the dimensions is tricky -- I thought they might be discrete vs. continuous and pure vs. applied.) I've also seen a political map like this, based on the voting records of U. S. Senators and Representatives; it's kind of fascinating to watch how the two parties have moved around with time, and how you can explain almost as much variation between politicians by just looking at a single variable as you used to need two variables for. You can almost predict who will vote for a given bill just by lining up the Senators from "most liberal" to "most conservative" and drawing a line somewhere to separate the two sides. Life is more complicated than that.
I wonder if one could use a plot like this (or the data which underlies it) to predict which international borders are likely to create a lot of tension. For example, the U. S. is (according to this plot) much more similar to Canada than it is to Mexico, and there seems to be a lot more tension at the U. S.'s southern border than at its northern one. Perhaps one could predict strife within a country as well, if a survey like this was done for subnational entities. Lumping the entire United States together seems almost ludicrous to me.
Also, how is this sort of thing correlated with language? And if the language spoken in a country changes, for whatever reason, is this correlated with that country becoming more like countries that speak the new language? It seems reasonable that there should be some connection between language and culture, if only because most of culture is expressed through language. But causation is a problem; do countries become more like each other because they speak the same language, or do countries that speak the same language become more like each other?
17 September 2007
142857
A web site devoted to the number 142857.
1/7 = 0.142857142857142857142857142857142857...
and, for example, 142857 * 2 = 285714 -- the same digits, but in a different order.
There are some facts I hadn't seen, too, like 8572 - 1422 = 714285, and the pair 1428572 = 20408122449, 20408+12249 = 142857. The first one has a nice "approximate" explanation, namely that (6/7)2 - (1/7)2 = 5/7 (multiply both sides by 106), but I don't even see why the second one has any chance of being true.
Hand-waving asymptotics of the primorial function
Let n# be the "primorial" function, which is the product of all the primes less than or equal to n. So, for example, 7# = 8# = 9# = 10# = (2)(3)(5)(7) = 210.
A friend of mine asked for a proof that n# > n, for n ≥ 3.
The easiest proof I can think of is as follows: you begin with Bertrand's postulate, which states that there is always a prime in the interval [k+1, 2k] for any k. (The link goes to David Galvin's exposition of Erdos' elementary proof of this fact, which inspired the following rhyme from Erdos: "Chebyshev said it, and I say it again/There is always a prime between n and 2n." This proof depends on some properties of the prime factorizations of binomial coefficients.)
In particular, there is a prime p, which depends on n, in the interval (n/2, n]; this prime is strictly greater than n/2. Also, 2 is a prime. If n ≥ 4, then p ≠ 2, and we have n# > 2p > 2(n/2) = n. We only need to check n = 3, which is easy: 3# = (2)(3) = 6.
Of course, this proof is throwing out a ridiculously large amount of information. From repeatedly applying Bertrand's postulate we can do better; in particular we get n# > (n/2) (n/2)#. (I'm ignoring the fact that n/2 might not be an integer.) Repeating this we get n# > (n/2) (n/4) (n/4)#, and so on. If we repeat this k times, where k is the greatest integer less than log2 n times, we get
n# > (n/2) (n/4) ... (n/2k) = nk / 21+2+...+k = nk / 2k(k+1)/2.
Recalling that 2k ≈ n, this is
nlg n / n((lg n) + 1)/2
or on the order of n(lg n)/2. (lg denotes the base-2 logarithm.) For example, this tells us that 100# is at least 106 or so.
It's suspected that for all n > 1, there is a prime with n2 < p < (n+1)2. This gives a stronger lower bound. Namely, let k be the largest integer less than or equal to n1/2. Thenn if this conjecture is true, there's a prime in each of (1,4), (4,9), (9,16), (16,25), ..., ((k-1)2, k2). The product of these primes is at least
(1)(4)(9)...((k-1)2)
or ((k-1)!)2; this is on the order of (k/2e)k. (I've replaced k-1 with k here, and used Stirling's approximation.) Recalling that k ~ n1/2, this is (√(n)/2e)√(n). For n = 100, this means 100# is at least 1011 or so. (I'm not actually willing to write n# > (√(n)/2e)√(n) because I haven't carefully considered what's going on at the endpoints of the products.)
And here's a quick heuristic justification for why n# is about en. Consider log n#; this is
Σk=1n (log k) [k is prime]
where the expression "[n is prime]" is 1 if n is prime and 0 isn't. Now, from the Prime Number Theorem we know that the the "probability" that n is prime is 1/(log n). (This is how I remember the Prime Number Theorem; it's a bit silly, because a number is either prime or it's not, but I find it a useful heuristic.) So the "expectation" of log n# is
Σk=1n (log k) (1/log k)
which is just the sum of n terms, each of which is equal to 1. So, in fact, 100# is about 1043. (This argument, of course, isn't rigorous.)
correction to multiple zeta values post: Hoffman's relation
On Friday I made a post about multiple zeta values and was frustrated by my inability to find, for example, ζ(2,1).
Sarah Carr has informed me of the missing relation, "Hoffman's relation", which is used for calculating non-convergent ζ values:
For any convergent sequence of positive integers, k = (k1, ... ,kd) and its
corresponding sequence of 0's and 1's, ε = (0k1-11,...,0kd-11), then Σσ ζ(σ) = 0 where σ runs over all the terms in (1)*k - (1) Ш ε
I'm not particularly interested in finding it anymore (I have bigger fish to fry at the moment), but in the interests of completeness I wanted to make sure I had this right.
16 September 2007
hard science, and calculating the area of a circle
The Really Hard Science, by Michael Shermer, from the October 2007 issue of Scientific American. The author makes the claim that the traditional distinction between "hard" and "soft" science is backwards; the social sciences might more reasonably be considered harder. I'm not sure how much I buy this linguistic claim, because "hard" has two antonyms in English, "soft" and "easy", and I suspect there's a reason we call the social sciences "soft sciences", not "easy sciences". The point that all these disciplines are valuable, I support. Shermer points out that modeling a biological or social system is often more difficult than modeling a physical system. We tend to think of the mathematics used by physicists as more complicated than that used by social scientists, but how much of that is a reflection of the subject matter and how much of that is due to the historical alliance between mathematicians and physicists, which means that physicists have tended to know lots of mathematics and, say, sociologists don't know as much? (I struggle with this in teaching calculus; our textbook, like many calculus textbooks, draws a lot of its examples from physics -- centers of mass, moments of inertia, and such -- and the students aren't as likely to be conversant with physics as the authors of the text seem to assume.)
He writes the following:
Which is more important in calculating the area of a circle? I say r2. It's interesting that there is a constant, but the way in which the area of the circle grows when you increase the radius (namely, twice as fast) is more important to me. I may only be saying this, though, because I don't have to actually calculate the area of a circle. The people who made the circular table I'm sitting at certainly care about π to tell them how much raw material they will need.
The "twice as fast" statement there is a bit vague, but I mean it in the sense that if one increases the radius of a circle by some small fraction ε (as usual, ε2 = 0), one increases its area by the fraction 2ε. That is,
π(r(1+ε))2 = π(r2 + 2εr2+ ε2r2) = (πr2)(1+2ε)
where the last equality assumes ε2 = 0. For the most part this is how I think of derivatives -- at least simple ones like this -- in my head. The ε2 = 0 idea is the sort of thing one might see in the proposed "wiki of mathematical tricks" of Tao and Gowers (the real meat of the discussion is actually in the comments on those posts), although perhaps at a slightly lower level than they're aiming at.
He writes the following:
Between technical and popular science writing is what I call “integrative science,” a process that blends data, theory and narrative. Without all three of these metaphorical legs, the seat on which the enterprise of science rests would collapse. Attempts to determine which of the three legs has the greatest value is on par with debating whether π or r2 is the most important factor in computing the area of a circle.
Which is more important in calculating the area of a circle? I say r2. It's interesting that there is a constant, but the way in which the area of the circle grows when you increase the radius (namely, twice as fast) is more important to me. I may only be saying this, though, because I don't have to actually calculate the area of a circle. The people who made the circular table I'm sitting at certainly care about π to tell them how much raw material they will need.
The "twice as fast" statement there is a bit vague, but I mean it in the sense that if one increases the radius of a circle by some small fraction ε (as usual, ε2 = 0), one increases its area by the fraction 2ε. That is,
π(r(1+ε))2 = π(r2 + 2εr2+ ε2r2) = (πr2)(1+2ε)
where the last equality assumes ε2 = 0. For the most part this is how I think of derivatives -- at least simple ones like this -- in my head. The ε2 = 0 idea is the sort of thing one might see in the proposed "wiki of mathematical tricks" of Tao and Gowers (the real meat of the discussion is actually in the comments on those posts), although perhaps at a slightly lower level than they're aiming at.
15 September 2007
just noticeable difference of temperature?
Down with the metre and litre, claims that the sizes of metric units are unintuitive: "On the other hand, a degree celsius is too large and imprecise. By contrast, the Fahrenheit scale was custom made to measure weather phenomena: it has human scale."
A celsius degree is 1.8 times the size of a Fahrenheit degree.
Do people who claim this seriously think that they can tell the difference between, say, 61 degrees Fahrenheit and 62.8 degrees Fahrenheit? I don't think they could, and so I would claim that even the Celsius degree is small enough for "everyday" purposes. (In weather forecasts given in Fahrenheit one often refers to, say, the "low seventies" or the "mid-sixties" which seems to imply a resolution of about three or four degrees.) I claim that in both scales, one degree is less than the just noticeable difference for atmospheric temperatures, although I can't quickly find out if the people who study this back me up.
(One thing I do like about using the Fahrenheit scale for weather is that almost all weather I experience is between about 0 degrees and 100 degrees. In some tellings of the story, that's said to be deliberate. There is something weird about negative temperatures, but I'm not quite crazy enough to just start stating all temperatures in Kelvins.)
Why g ~ π2
The acceleration due to gravity, at the surface of the Earth, is about 9.81 m/s2. (If you are some of my students, you think it's 10, which is confusing for a moment. Fortunately none of my students thought it was 32.)
π2 = 9.87.
The approximate numerical equality of these numbers is not a coincidence.
I was reminded of this by Mark Dominus' post John Wilkins invents the meter, which I found via his post The Wilkins pendulum mystery resolved. In 1668, John Wilkins defined the meter to be essentially the length of the "seconds pendulum", i. e. the pendulum whose period is two seconds (the "mystery" there is that since one wants a pendulum with a light cord and a heavy bob, one has to take into account the moment of inertia of the heavy spherical bob to define this correctly). This turns out to be about 39.1 inches.
A meter is 39.37 inches.
Indeed, originally the length of the seconds pendulum was going to be the length of the meter, but the slightly different suggestion was adopted instead that the meter would be one part in 107 of the distance from the North Pole to the Equator via Paris. (Now, in fact, the meter is defined by assuming the second known and stating the speed of light.) Wikipedia tells me that these definitions were adopted in 1790, 1791, and 1983 respectively; there are others intermediate between the last two.)
The period of a pendulum is approximately T = 2π(L/g)1/2, where L is its length and g is the acceleration due to gravity. If we set T = 2 and L = 1, and solve for g, we get g = π2.
I suspect that the reason the seconds pendulum wasn't adopted is that the formula for the period involves the small-angle approximation; in reality the period of a pendulum depends not only on its length and on the acceleration due to gravity but also on the angle through which it swings. The period is given by

and so the fractional magnitude of the error is about 1/4 sin2 (θ/2); if θ is, say, one degree this is one part in about fifty thousand, or nearly two seconds a day. That error would become an error in the definition of the meter, and perhaps the Powers that Were thought that was a bit too much. (I'm not sure how accurate surveying was at the time, though, so I can't comment on the accuracy of their eventual definition based on the size of the Earth.)
π2 = 9.87.
The approximate numerical equality of these numbers is not a coincidence.
I was reminded of this by Mark Dominus' post John Wilkins invents the meter, which I found via his post The Wilkins pendulum mystery resolved. In 1668, John Wilkins defined the meter to be essentially the length of the "seconds pendulum", i. e. the pendulum whose period is two seconds (the "mystery" there is that since one wants a pendulum with a light cord and a heavy bob, one has to take into account the moment of inertia of the heavy spherical bob to define this correctly). This turns out to be about 39.1 inches.
A meter is 39.37 inches.
Indeed, originally the length of the seconds pendulum was going to be the length of the meter, but the slightly different suggestion was adopted instead that the meter would be one part in 107 of the distance from the North Pole to the Equator via Paris. (Now, in fact, the meter is defined by assuming the second known and stating the speed of light.) Wikipedia tells me that these definitions were adopted in 1790, 1791, and 1983 respectively; there are others intermediate between the last two.)
The period of a pendulum is approximately T = 2π(L/g)1/2, where L is its length and g is the acceleration due to gravity. If we set T = 2 and L = 1, and solve for g, we get g = π2.
I suspect that the reason the seconds pendulum wasn't adopted is that the formula for the period involves the small-angle approximation; in reality the period of a pendulum depends not only on its length and on the acceleration due to gravity but also on the angle through which it swings. The period is given by
and so the fractional magnitude of the error is about 1/4 sin2 (θ/2); if θ is, say, one degree this is one part in about fifty thousand, or nearly two seconds a day. That error would become an error in the definition of the meter, and perhaps the Powers that Were thought that was a bit too much. (I'm not sure how accurate surveying was at the time, though, so I can't comment on the accuracy of their eventual definition based on the size of the Earth.)
14 September 2007
multiple zeta values
Today I learned about Multiple Zeta Values in my department's graduate student "pizza" seminar. The speaker was Sarah Carr; the link is to her notes. Some of what follows basically rehashes definitions and conjectures from her notes; some of this is my own thoughts. In the future, you might expect to find math that I don't really understand but am pretending to on Fridays, because that's when this seminar meets.
One can define the "multiple zeta value" of a sequence of positive integers (k1, ..., kd), with k1 ≥ 2 (a condition which is needed for convergence), in the following way:

The ordinary Riemann zeta function is just the special case where d=1.
It turns out that these obey certain nice relations which can be found basically by just looking at the sums, for example
ζ(a) ζ(b) = ζ(a, b) + ζ(b, a) + ζ(a+b).
This allows one to compute some of these values; for example, if a = b = 2, we get
ζ(2)2 = 2 ζ(2, 2) + ζ(4)
and using a certain well-known results of Euler, namely that ζ(2) = π2/6 and ζ(4) = π4/90, we get ζ(2,2) = π4/120. Of course, one doesn't want to write ζ over and over again when studying these things, so we'd write something like
(a) * (b) = (a, b) + (b, a) + (a+b)
and this "*" is an example what's called the "stuffle product". (I swear I'm not making this name up!) You can read Carr's notes for the definition in general.
There's a natural way in which we can view sequences of integers as sequences of 0's and 1's; namely, replace each occurence of a by a-1 0's followed by a 1, so, for example, the sequence (2, 3) becomes (0, 1, 0, 0, 1). On these sequences one can define a relation called the "shuffle product", on which one has, for example,
(0, 1) Ш (0, 1) = 2(0, 1, 0, 1) + 4(0, 0, 1, 1)
or, in the original notation,
(2) Ш (2) = 2(2, 2) + 4(3, 1).
Sticking the ζs back in and turning Ш into multiplication is allowed; this is a result of Kontsevich. The proof hinges on a representation of ζ values as integrals, which is pretty natural; the integrals in question have nice power series expansions that coincide with the definition of the ζ values. Doing this, you get
ζ(2)2 = 2ζ(2,2) + 4ζ(3,1)
from which we conclude that ζ(3,1) = ζ(4)/4 = π4/360.
It turns out, though, that the relations one gets from considering the * and Ш operations are graded, in the sense that given a relation among the ζ values, the sum of the arguments in each term of that relation (the "weight" of each term) will be the same. For example, in the relation
ζ(2)2 = 2ζ(2,2) + 4ζ(3,1)
the three terms have weight 2+2, 2+2, and 3+1 respectively. It's conjectured that all the relations among ζ values come from * and Ш, from which it would follow are no relations among ζ values of different weight; this would mean that all ζ values are transcendental. Since putting a sequence which sums to m and one which sums to n into either * or Ш gives a sequence which sums to m+n, this would mean that the ζ values form a graded algebra.
I also don't know how many relations there are among ζ values of the same weight; one might hope that there are enough that we can find all the ζ values of even weight exactly by purely algebraic means, given that we know ζ(2n)? (In particular, this would imply that ζ of any sequence summing to 2n is π2n times some rational number; above, we see that ζ(4), ζ(3,1) and ζ(2,2) are all rational multiples of π4. But I don't have too much hope for that conjecture, because I can't even find ζ(2,1,1) that way! (I think that my inability to do this would follow from a conjecture of Zagier mentioned in Carr's notes, on the dimension of the grade-n part of the algebra of ζ values, but I don't trust myself.)
CORRECTION, Monday, September 17: There's a missing relation that I didn't know about. See this post.
One can define the "multiple zeta value" of a sequence of positive integers (k1, ..., kd), with k1 ≥ 2 (a condition which is needed for convergence), in the following way:
The ordinary Riemann zeta function is just the special case where d=1.
It turns out that these obey certain nice relations which can be found basically by just looking at the sums, for example
ζ(a) ζ(b) = ζ(a, b) + ζ(b, a) + ζ(a+b).
This allows one to compute some of these values; for example, if a = b = 2, we get
ζ(2)2 = 2 ζ(2, 2) + ζ(4)
and using a certain well-known results of Euler, namely that ζ(2) = π2/6 and ζ(4) = π4/90, we get ζ(2,2) = π4/120. Of course, one doesn't want to write ζ over and over again when studying these things, so we'd write something like
(a) * (b) = (a, b) + (b, a) + (a+b)
and this "*" is an example what's called the "stuffle product". (I swear I'm not making this name up!) You can read Carr's notes for the definition in general.
There's a natural way in which we can view sequences of integers as sequences of 0's and 1's; namely, replace each occurence of a by a-1 0's followed by a 1, so, for example, the sequence (2, 3) becomes (0, 1, 0, 0, 1). On these sequences one can define a relation called the "shuffle product", on which one has, for example,
(0, 1) Ш (0, 1) = 2(0, 1, 0, 1) + 4(0, 0, 1, 1)
or, in the original notation,
(2) Ш (2) = 2(2, 2) + 4(3, 1).
Sticking the ζs back in and turning Ш into multiplication is allowed; this is a result of Kontsevich. The proof hinges on a representation of ζ values as integrals, which is pretty natural; the integrals in question have nice power series expansions that coincide with the definition of the ζ values. Doing this, you get
ζ(2)2 = 2ζ(2,2) + 4ζ(3,1)
from which we conclude that ζ(3,1) = ζ(4)/4 = π4/360.
It turns out, though, that the relations one gets from considering the * and Ш operations are graded, in the sense that given a relation among the ζ values, the sum of the arguments in each term of that relation (the "weight" of each term) will be the same. For example, in the relation
ζ(2)2 = 2ζ(2,2) + 4ζ(3,1)
the three terms have weight 2+2, 2+2, and 3+1 respectively. It's conjectured that all the relations among ζ values come from * and Ш, from which it would follow are no relations among ζ values of different weight; this would mean that all ζ values are transcendental. Since putting a sequence which sums to m and one which sums to n into either * or Ш gives a sequence which sums to m+n, this would mean that the ζ values form a graded algebra.
I also don't know how many relations there are among ζ values of the same weight; one might hope that there are enough that we can find all the ζ values of even weight exactly by purely algebraic means, given that we know ζ(2n)? (In particular, this would imply that ζ of any sequence summing to 2n is π2n times some rational number; above, we see that ζ(4), ζ(3,1) and ζ(2,2) are all rational multiples of π4. But I don't have too much hope for that conjecture, because I can't even find ζ(2,1,1) that way! (I think that my inability to do this would follow from a conjecture of Zagier mentioned in Carr's notes, on the dimension of the grade-n part of the algebra of ζ values, but I don't trust myself.)
CORRECTION, Monday, September 17: There's a missing relation that I didn't know about. See this post.
Subscribe to:
Posts (Atom)
