Here's a question: Did Obama do better among African-Americans or Prius owners?
The consensus is that he did better among African-Americans. (96% of African-Americans who voted voted for him, which is a pretty high bar.)
But how would one go about estimating how he did among Prius owners?
21 May 2010
17 May 2010
Innumeracy and the NBA draft lottery
I don't really know much about basketball. But this New York Times article suggests that the first pick in the NBA lottery might not be worth much this year, and then goes on to say:
Here's how the NBA draft lottery works. In short: there are thirty teams in the NBA. Sixteen makes the playoff. The other fourteen are entered in the draft lottery. Fourteen ping-pong balls (it's a coincidence that the numbers are the same) are placed in a tumbler. There are 1001 ways to pick four balls from fourteen. Of these, 1000 are assigned to the various teams; the worse teams are assigned more combinations. 250 are assigned to the worst team, 199 to the second-worst team, "and so on". (It's not clear to me where the numbers come from.)
Then four balls are picked. The team that this set corresponds to gets the first pick in the draft. Those balls are replaced; another set is picked, and this team (assuming it's not the team already picked) gets the second pick. This process is repeated to determine the team with the third pick. At this point there's an arbitrary cutoff; the 4th through 14th picks are assigned to the eleven unassigned teams, from worst to best. The reason for this method seems to be so that all the lottery teams have some chance of getting one of the first three picks, but no team does much worse than would be expected from its record; if the worst team got the 14th pick they wouldn't be happy.
So the probability that the team with the worst record wins the lottery is one in four, by construction; this "history suggests" is meaningless. (And the article even mentions the 25 percent probability!) This isn't like situations within the game itself where the probabilities can't be derived from first principles and have to be worked out from observation.
Also, let's say we continued iterating this process to pick the order of all the lottery teams. How would one expect the order of draft picks to compare to the order of finish in the league? I don't know off the top of my head.
But history suggests that he [Rod Thorn, president of the New Jersey Nets] will not have that decision to make. Since 1994, the team with the worst record has won the lottery only once — Orlando in 2004.
Here's how the NBA draft lottery works. In short: there are thirty teams in the NBA. Sixteen makes the playoff. The other fourteen are entered in the draft lottery. Fourteen ping-pong balls (it's a coincidence that the numbers are the same) are placed in a tumbler. There are 1001 ways to pick four balls from fourteen. Of these, 1000 are assigned to the various teams; the worse teams are assigned more combinations. 250 are assigned to the worst team, 199 to the second-worst team, "and so on". (It's not clear to me where the numbers come from.)
Then four balls are picked. The team that this set corresponds to gets the first pick in the draft. Those balls are replaced; another set is picked, and this team (assuming it's not the team already picked) gets the second pick. This process is repeated to determine the team with the third pick. At this point there's an arbitrary cutoff; the 4th through 14th picks are assigned to the eleven unassigned teams, from worst to best. The reason for this method seems to be so that all the lottery teams have some chance of getting one of the first three picks, but no team does much worse than would be expected from its record; if the worst team got the 14th pick they wouldn't be happy.
So the probability that the team with the worst record wins the lottery is one in four, by construction; this "history suggests" is meaningless. (And the article even mentions the 25 percent probability!) This isn't like situations within the game itself where the probabilities can't be derived from first principles and have to be worked out from observation.
Also, let's say we continued iterating this process to pick the order of all the lottery teams. How would one expect the order of draft picks to compare to the order of finish in the league? I don't know off the top of my head.
On swashbuckling experimentalists
Chad Orzel, physicist, writes why I'd never make it as a mathematician. He calls himself a "swashbuckling experimentalist" and says that he doesn't like thinking too hard about questions of convergence and the like. This is in reference to Matt Springer's most recent Sunday function, which gives the paradox:
1 - 1/2 + 1/3 - 1/4 + ... = log 2
1 - 1/2 - 1/4 + 1/3 - 1/6 - 1/8 + ... = (log 2)/2
I find that I tend to act "like a physicist" in my more experimental work. Often I'm dealing with the coefficients of some complicated power series (usually a generating function) which I can compute (with computer assistance) and don't understand too well. Most of the time the things that "look true" are. This work is, in some ways, experimental, which is why it's tempting to act like a physicist.
Oh, yeah, I graduated today.
13 May 2010
Are you smarter than a Fields medalist?
Take the Economist's numeracy quiz.
If you get all five questions right, you did better than Terence Tao.
The quiz is linked to this article, which states that people who are better at doing simple financial calculations seem to be less likely to fall behind on their mortgages.
Rather annoyingly, The Economist doesn't even tell you the names of the people who did the study. But it's Financial Literacy and Subprime Mortgage Delinquency: Evidence from a Survey Matched to Administrative Data, by Kristopher Gerardi, Lorenz Goette, and Stephan Meier. I will admit I have not read it, because it's 54 pages. (But yes, they controlled for income. My first thought was that maybe people who are better with numbers also tend to make more money.) Gerardi also writes for the Atlanta Fed's blog on real estate research.
11 May 2010
The NIST Handbook of Mathematical Functions
The National Institute of Standards and Technology has released what you might call a "trailer" for the revised edition of Abramowitz and Stegun's Handbook of Mathematical Functions. The original version is available online (it's public domain).
The print version is called the NIST Handbook of Mathematical Functions, and is available in hardcover and paperback
 .
.
There is also, not surprisingly, an online version, the Digital Library of Mathematical Functions, which takes advantage of new technology: three-dimensional graphics, color, etc. Think MathWorld, but less idiosyncratic. It jsut went public today.
And it includes Stanley's Twelvefold Way, which makes me smile.
However, some small part of the original Handbook's primacy as a reference comes from the fact that in a list of papers which are alphabetical by last name of the first author, it usually comes first. The first editor of the new book is Frank Olver, so it won't have that advantage.
The print version is called the NIST Handbook of Mathematical Functions, and is available in hardcover
There is also, not surprisingly, an online version, the Digital Library of Mathematical Functions, which takes advantage of new technology: three-dimensional graphics, color, etc. Think MathWorld, but less idiosyncratic. It jsut went public today.
And it includes Stanley's Twelvefold Way, which makes me smile.
However, some small part of the original Handbook's primacy as a reference comes from the fact that in a list of papers which are alphabetical by last name of the first author, it usually comes first. The first editor of the new book is Frank Olver, so it won't have that advantage.
07 May 2010
Fibonacci cutting board
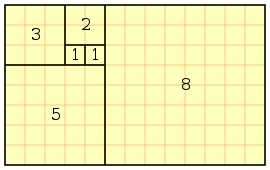
The Fibonacci cutting board is being sold by 1337motif at etsy. (Note: that's pronounced "leetmotif"; it took me a while to figure it out.) It's basically this tiling, where a rectangle of size Fn by Fn+1 is repeatedly decomposed into a square of size Fn by Fn and a rectangle of size Fn-1 by Fn, but made of wood instead of pixels.
There's also the double Fibonacci cutting board made in a similar pattern.
1337motif is Cameron Oehler's work. Nost of his other work is inspired by video games; you can see it here. I wonder how often the cutting boards get used as cutting boards; at $125, if I had one I'd hang it on the wall and not get food on it. Personally, I'd like a Sierpinski triangle cutting board.
05 May 2010
Street-Fighting Mathematics is a book
From the Chronicle of Higher Education: The Gospel of Well-Educated Guessing, on Sanjoy Mahajan's Street-Fighting Mathematics. (Previously: here, and here.) It's now a real book!
Here's a calculation I hadn't heard of before, and don't actually know the details of:
I've recently priced PHL-(SFO/OAK) flights, and this is roughly right. (And this uses chemistry, which is awesome because I was a chemist in a former life. Gasoline and fat are both basically long chains of carbon atoms.) The article tells of other similar party tricks. It would be nice to see some details, but the Chronicle seems to pitch itself at a humanities-ish audience.
Here's a calculation I hadn't heard of before, and don't actually know the details of:
They were both right, in a sense: some of the calculations he pulls off have a hint of Houdini. For instance, he can start with two paper cones, to find the relation between drag force and velocity, and—believe it or not—arrive at the cost of a round-trip plane ticket from New York to Los Angeles. He works out the problem in a blur of equations, remarking that a gram of gasoline and a gram of fat contain the same amount of energy, that drag force is proportional to velocity squared, and so on. The number he arrives at ($700) isn't the cheapest deal out there, but it's roughly right.
I've recently priced PHL-(SFO/OAK) flights, and this is roughly right. (And this uses chemistry, which is awesome because I was a chemist in a former life. Gasoline and fat are both basically long chains of carbon atoms.) The article tells of other similar party tricks. It would be nice to see some details, but the Chronicle seems to pitch itself at a humanities-ish audience.
02 May 2010
Arithmetic geometers write about statistics
Jordan Ellenberg, in yesterday's Washington Post: The census will be wrong. We could fix it.
This continues a proud tradition of mathematicians whose area of expertise is nowhere near statistics writing newspaper pieces saying that statistical sampling in censuses a good idea; Brian Conrad, 1998, New York Times.
In some sense it carries more weight when mathematicians who don't spend most of their time battling randomness in some sort or another . Statisticians of course think that doing statistical adjustments to the census in order to make it more accurate is a Good Idea; it gets them, their students, or their friends jobs!
As a combinatorialist I admire the theoretical elegance of our country's once-a-decade exercise in large-scale, brute-force combinatorics. But in practice, well, of course it needs some statistical help.
And here's something interesting:
Since 1970, a mail-in survey has provided the majority of census data, so what we enumerate is not people but numbers written on a form, which are as likely to be fictional as any statistical estimate.I wonder if people are actually lying on their census forms. I suspect this would skew the count upwards. People who deliberately lie on their census forms, at least the sort of people I know, are likely to give "joke" answers. And large numbers are funnier. I live in a one-bedroom apartment, and if I were the sort of person who lied on government forms I would easily say that ten people live in my apartment. I can't give a comically low number of people living here, because the census insists that a positive integer number of people live in each place. Does the census has some sort of way to correct for this?
01 May 2010
The probability that 901 coins have total value $100
Here's a cute little problem from Reddit: Tough question for you guys. Let's say you have 901 coins that come out to exactly $100. What are the odds? (Also here.)
Everyone there who gets a solution is assuming that all the possible coins are equally likely, which isn't a reasonable assumption. Years ago I looked at the density of money, where I used a model in which I get back from each transaction n cents with probability 0.01, for n = 0, 1, ... 99; furthermore I always get back the smallest possible number of coins. The only coins allowed are pennies, nickels, dimes, and quarters (worth 1, 5, 10, and 25 cents respectively).
As I calculated before, if I make 100 transactions, and I get each number of cents back exactly once, I'll get 200 pennies, 40 nickels, 80 dimes, and 150 quarters. This is a total of 470 coins, and worth $49.50. Thus the "average coin" is worth 495/47 = 10.53 cents; 901 coins are "on average" worth $94.89. The value $100 isn't that unreasonable.
So consider a jar with 901 coins, which are independent; they each have probability 20/47 of being a penny, 4/47 of being a nickel, 8/47 of being a dime, and 15/47 of being a quarter. The mean value of a coin is 495/47 = 10.53 cents; the variance is 238840/2309 = 108.12 "square cents".
The mean value of 901 coins, then, is 9489 cents; the variance is 93198 "square cents", so the standard deviation is 305 cents. (Everything here is rounded to the nearest integer.)
Invoking the central limit theorem, then, we say that the value of 901 randomly chosen coins is normally distributed with this mean and standard deviation. The probability of having value exactly 10,000 cents is approximated by the probability density function of this variable at 10,000; that's 0.000322, or 1 in 3101.
An exact answer is feasible -- but not worth computing, I'd say, because the error in the central limit theorem is surely much smaller than the error from the fact that this isn't a realistic model of what actually ends up in your change jar.
Subscribe to:
Posts (Atom)

