Not only does God throw dice, but Einstein does too, or at least a stencil of him on a wall in the Upper Haight in San Francisco does. This post suggests that it may have been by the graffiti artist Banksy. It's been painted over.
More pictures here and here.
It's been painted over, apparently. That's probably for the best, because that means I won't try to find it when I move to the Bay Area.
(Oh, yeah, I'm moving! I got a job at Berkeley.)
01 July 2010
30 June 2010
How not to visualize the electoral college
I went to the National Constitution Center in Philadelphia today.
As you may know, the Constitution provides that, in elections for the President, each state receives a number of electors equal to its total number of senators and representatives. Each state has two senators, and the number of representatives is proportional to the population. The number of representatives is adjusted after the census, which happens in years divisible by ten.
Why am I telling you this? Because at one point on the wall there was an animated map, which displayed how apportionment had changed between censuses. Each state was represented as a "cylinder", with base the state itself and height proportional to its number of electors. (Or representatives; it honestly would be impossible to tell the difference by eye, as in this scheme that would just push everything up by two units.) There was one such display in the animation for each census, with smooth transitions between them.
Since the eye wants to interpret the "volume" of a state as its number of electors, this has the effect of making geographically-large states look like they have better representation than they do. I noticed this by looking at New Jersey and Pennsylvania, which have areas of 7417 and 44817 square miles, and 15 and 21 electors respectively. The solid corresponding to Pennsylvania has about eight times the volume as that corresponding to New Jersey. New Jersey's an easy one to look at because it happens to be the most densely populated state at the present time, and in this visualization it is not the tallest.
The volume of the solid corresponding to each state is proportional to the product of its number of its electors and its area. The states for which this product is largest are, in order, Texas, California, Alaska, New York, Florida, Illinois, Arizona, Michigan, Pennsylvania, and Colorado. The first two of these, between them, have 41% of the total volume in this visualization.
I'd suggest replacing this with a model where volume is proportional to the number of electoral votes. Or, since that might have its own problems, a cartogram which evolves in time. The West would just grow out of nowhere.
23 June 2010
The ridiculously long match at Wimbledon
As you may have heard, there's a match at Wimbledon , between John Isner and Nicolas Mahut, in which the last set is tied at 59 games. (The previous longest set at Wimbledon was 24-22.)
A set goes until one player has won six games, and has also won two more than the opponent. This means that back since the set was tied at 5 games, games 11 and 12 were split by the two players; so were 13 and 14; and so on up to 117 and 118.
Terence Tao points out that this is very unlikely using a reasonable naive model of tennis, which assumes that the player serving has a fixed probability of winning the game. (Service alternates between games.) His guess is that some other factor is at play; for example, "both players may perform markedly better when they are behind".
This seems statistically checkable, at least if records of that sort of thing are kept. I'm not sure if they are; it seems like tennis scores are often reported as just the number of games won by each player in each set, not their order. Another hypothesis, of course, is that the match has taken on a life of its own and, subconsciously, the players are playing to keep the pattern going.
Edit (Thurs. 7:49 am): More on Isner-Mahut: Tim Gowers' comments, and some odds being offered by William Hill, the betting shop.
Reconstructing World Cup results
The final standings in Group C of the 2010 World Cup were as follows: USA 5, England 5, Slovenia 4, Algeria 1.
Question: given this information, can we reconstruct the results of the individual games? Each team plays each other team once; they get three points for a win, one for a draw, zero for a loss.
First we can tell that USA and England must have had a win and two draws, each; Slovenia, a win, a draw, and a loss; Algeria, a draw and two losses. (In fact you can always reconstruct the number of wins, draws, and losses from the number of points, except in the case of three points, which can be a win and two losses, or three draws.)
Since neither USA nor England have a loss, they must have drawn. Similarly, Slovenia's win must have been against Algeria.
But now there are two possibilities; we have to break the symmetry between USA and England. Let's say, arbitrarily, that USA drew against Slovenia and defeated Algeria, instead of the other way around. (This is, in fact, what happened.) Then Algeria's draw must have been against England, and England's win against Slovenia.
In an alternate universe where USA and England switch roles (does this mean that England was a USA colony in this universe?) USA defeated Slovenia and drew against Algeria, and England draws against Slovenia and defeats Algeria.
Of course, the next question is: given the goal differentials (+1 for USA and England, 0 for Slovenia, -2 for Algeria), can we figure out the margins in the various games? (Assume we know which of the two universes above we're in; for the sake of avoiding cognitive dissonance, say we're in the first one.) Since Algeria was only defeated by a total of two goals, the margin in each of their losses must have been 1. And the margin in the Slovenian win (to Algeria) and loss (to England) must have been the same, namely 1.
If you in addition are given the total number of goals scored (USA 4, Slovenia 3, England 2, Algeria 0) you can reconstruct the scores of each match. I leave this as an exercise for the reader. Hint: start with Algeria.
Another question: is it the "usual case" that individual match results can be recovered from the final standings, or is this unusual? The table of standings in a group in the World Cup has something like thirteen degrees of freedom. Given the number of wins and draws, goals scored, and goals against for three of the teams, we can find the number of losses and goal differential for each team, the number of wins, draws and losses for the fourth team, and the goal differential of the fourth team. We need one more piece of information - say, the number of goals scored by that fourth team - to reconstruct the whole table. We're trying to derive twelve numbers from this (the number of goals scored by each team in each match). It will be close.
In an n-team round robin, the number of degrees of freedom in the table of standings grows linearly with n, but the number of games grows quadratically with n. For large n it would be impossible to do this reconstruction; for n=1 it would be trivial.
21 June 2010
Bad word problems
An example of a bad word problem, from Frank Quinn's article The Nature of Contemporary Core Mathematics, who is at Virginia Tech:
Bubba has a still that produces 700 gallons of alcohol per
week. If the tax on alcohol is $1.50 per gallon, how much tax will Bubba pay in amonth? [Set up and analyze a model, then discuss applicability of the model.]
I have given an example with obvious cultural bias because I am not sure I could successfully avoid it. At any rate students in my area in rural Virginia would think this problem is hilarious. We have a long tradition of illegal distilleries and they would know that Bubba has no intention of ever paying any tax.
New MathOverflow-type sites?
As some of you may have noticed, I spend lots of time at MathOverflow these days. This explains my lack of posting.
Actually, my lack of posting is also in part because of taking a break after finishing my PhD. But I am now trying to prepare for the Next Step. The Next Step is an academic job, in fact, so if you've been holding your breath and wondering if I got one, you can breathe again. Details will follow, but the job is technically not official yet, so I don't want to say where it is here. My productive efforts are going towards preparing for courses I'll be teaching, factoring my dissertation (warning: large PDF) into papers, and moving my worldly possessions.
I'm posting in order to mention two potential sites hosted on the StackExchange platform that might be of interest to my readers (and also to MO users); these are one for statistical analysis and one for mathematics. The mathematics site will differ from MathOverflow in being somewhat lower-level, which I think is valuable; one of the things that's plagued MathOverflow from the beginning is that there are frequently questions which are clearly below the level of the site but we have nowhere good to send these questions! Similarly, MathOverflow gets a lot of statistics questions that the MO readership isn't equipped to handle. (People try on the questions that are really about probability, but some are about the more "practical" side of statistics and we don't have too many experts in that.)
If you click on those links, you can "commit" to participating in one or both of these sites. The idea is that once enough commitments are made, the site will be launched. This is StackExchange's new model; their old model was that people paid to have a site hosted with the software. This is the model on which MathOverflow works -- using money from Ravi Vakil's research funds -- but they don't do this any more, because there were ghost sites. See a fuller explanation.
14 June 2010
Euler's identity geometrized
How to explain Euler's identity using triangles and spirals, by Brian Slesinsky. (Euler's identity refers, here, to eiπ = -1.) Uses the geometric interpretation of complex multiplication to explain this fact.
21 May 2010
How did Obama do among Prius owners?
Here's a question: Did Obama do better among African-Americans or Prius owners?
The consensus is that he did better among African-Americans. (96% of African-Americans who voted voted for him, which is a pretty high bar.)
But how would one go about estimating how he did among Prius owners?
The consensus is that he did better among African-Americans. (96% of African-Americans who voted voted for him, which is a pretty high bar.)
But how would one go about estimating how he did among Prius owners?
17 May 2010
Innumeracy and the NBA draft lottery
I don't really know much about basketball. But this New York Times article suggests that the first pick in the NBA lottery might not be worth much this year, and then goes on to say:
Here's how the NBA draft lottery works. In short: there are thirty teams in the NBA. Sixteen makes the playoff. The other fourteen are entered in the draft lottery. Fourteen ping-pong balls (it's a coincidence that the numbers are the same) are placed in a tumbler. There are 1001 ways to pick four balls from fourteen. Of these, 1000 are assigned to the various teams; the worse teams are assigned more combinations. 250 are assigned to the worst team, 199 to the second-worst team, "and so on". (It's not clear to me where the numbers come from.)
Then four balls are picked. The team that this set corresponds to gets the first pick in the draft. Those balls are replaced; another set is picked, and this team (assuming it's not the team already picked) gets the second pick. This process is repeated to determine the team with the third pick. At this point there's an arbitrary cutoff; the 4th through 14th picks are assigned to the eleven unassigned teams, from worst to best. The reason for this method seems to be so that all the lottery teams have some chance of getting one of the first three picks, but no team does much worse than would be expected from its record; if the worst team got the 14th pick they wouldn't be happy.
So the probability that the team with the worst record wins the lottery is one in four, by construction; this "history suggests" is meaningless. (And the article even mentions the 25 percent probability!) This isn't like situations within the game itself where the probabilities can't be derived from first principles and have to be worked out from observation.
Also, let's say we continued iterating this process to pick the order of all the lottery teams. How would one expect the order of draft picks to compare to the order of finish in the league? I don't know off the top of my head.
But history suggests that he [Rod Thorn, president of the New Jersey Nets] will not have that decision to make. Since 1994, the team with the worst record has won the lottery only once — Orlando in 2004.
Here's how the NBA draft lottery works. In short: there are thirty teams in the NBA. Sixteen makes the playoff. The other fourteen are entered in the draft lottery. Fourteen ping-pong balls (it's a coincidence that the numbers are the same) are placed in a tumbler. There are 1001 ways to pick four balls from fourteen. Of these, 1000 are assigned to the various teams; the worse teams are assigned more combinations. 250 are assigned to the worst team, 199 to the second-worst team, "and so on". (It's not clear to me where the numbers come from.)
Then four balls are picked. The team that this set corresponds to gets the first pick in the draft. Those balls are replaced; another set is picked, and this team (assuming it's not the team already picked) gets the second pick. This process is repeated to determine the team with the third pick. At this point there's an arbitrary cutoff; the 4th through 14th picks are assigned to the eleven unassigned teams, from worst to best. The reason for this method seems to be so that all the lottery teams have some chance of getting one of the first three picks, but no team does much worse than would be expected from its record; if the worst team got the 14th pick they wouldn't be happy.
So the probability that the team with the worst record wins the lottery is one in four, by construction; this "history suggests" is meaningless. (And the article even mentions the 25 percent probability!) This isn't like situations within the game itself where the probabilities can't be derived from first principles and have to be worked out from observation.
Also, let's say we continued iterating this process to pick the order of all the lottery teams. How would one expect the order of draft picks to compare to the order of finish in the league? I don't know off the top of my head.
On swashbuckling experimentalists
Chad Orzel, physicist, writes why I'd never make it as a mathematician. He calls himself a "swashbuckling experimentalist" and says that he doesn't like thinking too hard about questions of convergence and the like. This is in reference to Matt Springer's most recent Sunday function, which gives the paradox:
1 - 1/2 + 1/3 - 1/4 + ... = log 2
1 - 1/2 - 1/4 + 1/3 - 1/6 - 1/8 + ... = (log 2)/2
I find that I tend to act "like a physicist" in my more experimental work. Often I'm dealing with the coefficients of some complicated power series (usually a generating function) which I can compute (with computer assistance) and don't understand too well. Most of the time the things that "look true" are. This work is, in some ways, experimental, which is why it's tempting to act like a physicist.
Oh, yeah, I graduated today.
13 May 2010
Are you smarter than a Fields medalist?
Take the Economist's numeracy quiz.
If you get all five questions right, you did better than Terence Tao.
The quiz is linked to this article, which states that people who are better at doing simple financial calculations seem to be less likely to fall behind on their mortgages.
Rather annoyingly, The Economist doesn't even tell you the names of the people who did the study. But it's Financial Literacy and Subprime Mortgage Delinquency: Evidence from a Survey Matched to Administrative Data, by Kristopher Gerardi, Lorenz Goette, and Stephan Meier. I will admit I have not read it, because it's 54 pages. (But yes, they controlled for income. My first thought was that maybe people who are better with numbers also tend to make more money.) Gerardi also writes for the Atlanta Fed's blog on real estate research.
11 May 2010
The NIST Handbook of Mathematical Functions
The National Institute of Standards and Technology has released what you might call a "trailer" for the revised edition of Abramowitz and Stegun's Handbook of Mathematical Functions. The original version is available online (it's public domain).
The print version is called the NIST Handbook of Mathematical Functions, and is available in hardcover and paperback
 .
.
There is also, not surprisingly, an online version, the Digital Library of Mathematical Functions, which takes advantage of new technology: three-dimensional graphics, color, etc. Think MathWorld, but less idiosyncratic. It jsut went public today.
And it includes Stanley's Twelvefold Way, which makes me smile.
However, some small part of the original Handbook's primacy as a reference comes from the fact that in a list of papers which are alphabetical by last name of the first author, it usually comes first. The first editor of the new book is Frank Olver, so it won't have that advantage.
The print version is called the NIST Handbook of Mathematical Functions, and is available in hardcover
There is also, not surprisingly, an online version, the Digital Library of Mathematical Functions, which takes advantage of new technology: three-dimensional graphics, color, etc. Think MathWorld, but less idiosyncratic. It jsut went public today.
And it includes Stanley's Twelvefold Way, which makes me smile.
However, some small part of the original Handbook's primacy as a reference comes from the fact that in a list of papers which are alphabetical by last name of the first author, it usually comes first. The first editor of the new book is Frank Olver, so it won't have that advantage.
07 May 2010
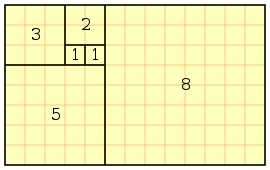
Fibonacci cutting board
The Fibonacci cutting board is being sold by 1337motif at etsy. (Note: that's pronounced "leetmotif"; it took me a while to figure it out.) It's basically this tiling, where a rectangle of size Fn by Fn+1 is repeatedly decomposed into a square of size Fn by Fn and a rectangle of size Fn-1 by Fn, but made of wood instead of pixels.
There's also the double Fibonacci cutting board made in a similar pattern.
1337motif is Cameron Oehler's work. Nost of his other work is inspired by video games; you can see it here. I wonder how often the cutting boards get used as cutting boards; at $125, if I had one I'd hang it on the wall and not get food on it. Personally, I'd like a Sierpinski triangle cutting board.
05 May 2010
Street-Fighting Mathematics is a book
From the Chronicle of Higher Education: The Gospel of Well-Educated Guessing, on Sanjoy Mahajan's Street-Fighting Mathematics. (Previously: here, and here.) It's now a real book!
Here's a calculation I hadn't heard of before, and don't actually know the details of:
I've recently priced PHL-(SFO/OAK) flights, and this is roughly right. (And this uses chemistry, which is awesome because I was a chemist in a former life. Gasoline and fat are both basically long chains of carbon atoms.) The article tells of other similar party tricks. It would be nice to see some details, but the Chronicle seems to pitch itself at a humanities-ish audience.
Here's a calculation I hadn't heard of before, and don't actually know the details of:
They were both right, in a sense: some of the calculations he pulls off have a hint of Houdini. For instance, he can start with two paper cones, to find the relation between drag force and velocity, and—believe it or not—arrive at the cost of a round-trip plane ticket from New York to Los Angeles. He works out the problem in a blur of equations, remarking that a gram of gasoline and a gram of fat contain the same amount of energy, that drag force is proportional to velocity squared, and so on. The number he arrives at ($700) isn't the cheapest deal out there, but it's roughly right.
I've recently priced PHL-(SFO/OAK) flights, and this is roughly right. (And this uses chemistry, which is awesome because I was a chemist in a former life. Gasoline and fat are both basically long chains of carbon atoms.) The article tells of other similar party tricks. It would be nice to see some details, but the Chronicle seems to pitch itself at a humanities-ish audience.
02 May 2010
Arithmetic geometers write about statistics
Jordan Ellenberg, in yesterday's Washington Post: The census will be wrong. We could fix it.
This continues a proud tradition of mathematicians whose area of expertise is nowhere near statistics writing newspaper pieces saying that statistical sampling in censuses a good idea; Brian Conrad, 1998, New York Times.
In some sense it carries more weight when mathematicians who don't spend most of their time battling randomness in some sort or another . Statisticians of course think that doing statistical adjustments to the census in order to make it more accurate is a Good Idea; it gets them, their students, or their friends jobs!
As a combinatorialist I admire the theoretical elegance of our country's once-a-decade exercise in large-scale, brute-force combinatorics. But in practice, well, of course it needs some statistical help.
And here's something interesting:
Since 1970, a mail-in survey has provided the majority of census data, so what we enumerate is not people but numbers written on a form, which are as likely to be fictional as any statistical estimate.I wonder if people are actually lying on their census forms. I suspect this would skew the count upwards. People who deliberately lie on their census forms, at least the sort of people I know, are likely to give "joke" answers. And large numbers are funnier. I live in a one-bedroom apartment, and if I were the sort of person who lied on government forms I would easily say that ten people live in my apartment. I can't give a comically low number of people living here, because the census insists that a positive integer number of people live in each place. Does the census has some sort of way to correct for this?
01 May 2010
The probability that 901 coins have total value $100
Here's a cute little problem from Reddit: Tough question for you guys. Let's say you have 901 coins that come out to exactly $100. What are the odds? (Also here.)
Everyone there who gets a solution is assuming that all the possible coins are equally likely, which isn't a reasonable assumption. Years ago I looked at the density of money, where I used a model in which I get back from each transaction n cents with probability 0.01, for n = 0, 1, ... 99; furthermore I always get back the smallest possible number of coins. The only coins allowed are pennies, nickels, dimes, and quarters (worth 1, 5, 10, and 25 cents respectively).
As I calculated before, if I make 100 transactions, and I get each number of cents back exactly once, I'll get 200 pennies, 40 nickels, 80 dimes, and 150 quarters. This is a total of 470 coins, and worth $49.50. Thus the "average coin" is worth 495/47 = 10.53 cents; 901 coins are "on average" worth $94.89. The value $100 isn't that unreasonable.
So consider a jar with 901 coins, which are independent; they each have probability 20/47 of being a penny, 4/47 of being a nickel, 8/47 of being a dime, and 15/47 of being a quarter. The mean value of a coin is 495/47 = 10.53 cents; the variance is 238840/2309 = 108.12 "square cents".
The mean value of 901 coins, then, is 9489 cents; the variance is 93198 "square cents", so the standard deviation is 305 cents. (Everything here is rounded to the nearest integer.)
Invoking the central limit theorem, then, we say that the value of 901 randomly chosen coins is normally distributed with this mean and standard deviation. The probability of having value exactly 10,000 cents is approximated by the probability density function of this variable at 10,000; that's 0.000322, or 1 in 3101.
An exact answer is feasible -- but not worth computing, I'd say, because the error in the central limit theorem is surely much smaller than the error from the fact that this isn't a realistic model of what actually ends up in your change jar.
29 April 2010
A simple model for baseball
From the April Notices of the AMS, John D'Angelo writes Baseball and Markov Chains: Power Hitting and Power Series. Consider the following simple model of baseball. Players only hit singles; three singles score a run. That is, the third and every following player to get a hit in a given inning score a run. This can either be interpreted as that, say, all runners score from second on a single or all runners go from first to third on a single -- but not both! -- or that every third hit is actually a double. (And I do mean exactly every third hit, not some random one-third of hits, so this is a bit unnatural.) Then the expected number of runs per half inning is p3(3p2-10p+10)/(1-p). For real baseball the average number of runs per half-inning is around one half, which corresponds to p = 0.361.
D'Angelo gives this as an exercise, but I independently came up with this model a while ago and can't resist sharing the solution. Let q = 1-p. The probability of getting k hits in an inning is pk q3 -- that's the probability of getting those hits in a certain order -- times the number of ways in which k hits and 3 outs can be arranged. Since the last batter of an inning must get out, the number of possible arrangements is the number of ways to pick 2 batters out of the first k+2 to get out, which is (k+2)(k+1)/2.
The probability of getting k runs, if k is at least 1, is just the probability of getting k+2 hits, which is pk+2q3(k+4)(k+3)/2. Call this f(k); then
f(1) + 2f(2) + 3f(3) + ... = p3(3p2-10p+10)/(1-p)
by some annoying algebra. I'm pretty sure I came up with this exact model while procrastinating from some real work a couple years ago; it's probably been independently reinvented many times.
With p = 0.361, the probabilities of scoring 0, 1, 2, 3, 4, 5 runs in an inning are .748, .123, .066, .034, .016, .008 (rounded to three decimal places). (Probabilities of larger numbers of runs can also be calculated; together they have probability around .006.)
Assuming that each half-inning is independent, the probability G(k) of a team scoring k runs in a game is, for each k,
with probability about 0.0006 of scoring 18 runs or more. (This seems a bit low to me -- three times a season in the major leagues -- but after all this is a very crude model!) But one interesting thing here is that the distribution of the number of runs per game, which is a sum of nine skewed distributions, is still skewed; the mode is 3, and the median 4. Recall that I chose p so that the mean would be 4.5. And the actual distribution is similarly skewed.
Of course a more sophisticated model of baseball is as a Markov chain. There are twenty-five states in this chain -- zero, one or two outs combined with eight possible ways to have runners on base, and three outs. We assume that each hitter hits randomly according to his actual statistics, and the runners move in the "appropriate" way. Of course determining what's appropriate here would be a bit tricky. How do runners move? A runner is probably more likely to take an extra base when a power hitter is hitting, but the sample size for any individual is fairly small. But one could probably predict from some measure of the hitter's power (say, the number of doubles and home runs, combined appropriately) the chances of a runner taking an extra base on a single. Something similar is necessary for sacrifice flies (which have to be deep enough to score the runner), grounding into double plays, etc. I'm not sure if the Markov models that are out there, such as that by Sagarin, do this. Sagarin computes the (offensive) value of a player by determining how many runs per game a team composed of only that player would score.
D'Angelo gives this as an exercise, but I independently came up with this model a while ago and can't resist sharing the solution. Let q = 1-p. The probability of getting k hits in an inning is pk q3 -- that's the probability of getting those hits in a certain order -- times the number of ways in which k hits and 3 outs can be arranged. Since the last batter of an inning must get out, the number of possible arrangements is the number of ways to pick 2 batters out of the first k+2 to get out, which is (k+2)(k+1)/2.
The probability of getting k runs, if k is at least 1, is just the probability of getting k+2 hits, which is pk+2q3(k+4)(k+3)/2. Call this f(k); then
f(1) + 2f(2) + 3f(3) + ... = p3(3p2-10p+10)/(1-p)
by some annoying algebra. I'm pretty sure I came up with this exact model while procrastinating from some real work a couple years ago; it's probably been independently reinvented many times.
With p = 0.361, the probabilities of scoring 0, 1, 2, 3, 4, 5 runs in an inning are .748, .123, .066, .034, .016, .008 (rounded to three decimal places). (Probabilities of larger numbers of runs can also be calculated; together they have probability around .006.)
Assuming that each half-inning is independent, the probability G(k) of a team scoring k runs in a game is, for each k,
| k | 0 | 1 | 2 | 3 | 4 | 5 |
| G(k) | .073 | .108 | .129 | .133 | .124 | .108 |
| k | 6 | 7 | 8 | 9 | 10 | 11 |
| G(k) | .088 | .069 | .052 | .038 | .026 | .018 |
| k | 12 | 13 | 14 | 15 | 16 | 17 |
| G(k) | .012 | .008 | .005 | .003 | .002 | .001 |
with probability about 0.0006 of scoring 18 runs or more. (This seems a bit low to me -- three times a season in the major leagues -- but after all this is a very crude model!) But one interesting thing here is that the distribution of the number of runs per game, which is a sum of nine skewed distributions, is still skewed; the mode is 3, and the median 4. Recall that I chose p so that the mean would be 4.5. And the actual distribution is similarly skewed.
Of course a more sophisticated model of baseball is as a Markov chain. There are twenty-five states in this chain -- zero, one or two outs combined with eight possible ways to have runners on base, and three outs. We assume that each hitter hits randomly according to his actual statistics, and the runners move in the "appropriate" way. Of course determining what's appropriate here would be a bit tricky. How do runners move? A runner is probably more likely to take an extra base when a power hitter is hitting, but the sample size for any individual is fairly small. But one could probably predict from some measure of the hitter's power (say, the number of doubles and home runs, combined appropriately) the chances of a runner taking an extra base on a single. Something similar is necessary for sacrifice flies (which have to be deep enough to score the runner), grounding into double plays, etc. I'm not sure if the Markov models that are out there, such as that by Sagarin, do this. Sagarin computes the (offensive) value of a player by determining how many runs per game a team composed of only that player would score.
28 April 2010
My thesis!
For the morbidly curious, here's my recently completed PhD thesis, Profiles of large combinatorial structures. (PDF, 1.1 MB, 262 pages (but double-spaced with wide margins)) This is why I haven't been posting!
Abstract: We derive limit laws for random combinatorial structures using singularity analysis of generating functions. We begin with a study of the Boltzmann samplers of Flajolet and collaborators, a useful method for generating large discrete structures at random which is useful both for providing intuition and conjecture and as a possible proof technique. We then apply generating functions and Boltzmann samplers to three main classes of objects: permutations with weighted cycles, involutions, and integer partitions. Random permutations in which each cycle carries a multiplicative weight σ have probability (1-γ)σ of having a random element be in a cycle of length longer than γn; this limit law also holds for cycles carrying multiplicative weights depending on their length and averaging σ. Such permutations have number of cycles asymptotically normally distributed with mean and variance ~ σ log n. For permutations with weights σk = 1/k or σk = k, other limit laws are found; the prior have finitely many cycles in expectation, the latter around √n. Compositions of uniformly chosen involutions of [n], on the other hand, have about √n cycles on average. These can be modeled as modified 2-regular graphs. A composition of two random involutions in Sn typically has about n1/2 cycles, characteristically of length n1/2. The number of factorizations of a random permutation into two involutions appears to be asymptotically lognormally distributed, which we prove for a closely related probabilistic model. We also consider connections to pattern avoidance, in particular to the distribution of the number of inversions in involutions. Last, we consider integer partitions. Various results on the shape of random partitions are simple to prove in the Boltzmann model. We give a (conjecturally tight) asymptotic bound on the number of partitions pM(n) in which all part multiplicities lie in some fixed set n, and explore when that asymptotic form satisfies log pM(n) ~ π√(Cn) for rational C. Finally we give probabilistic interpretations of various pairs of partition identities and study the Boltzmann model of a family of random objects interpolating between partitions and overpartitions.
Abstract: We derive limit laws for random combinatorial structures using singularity analysis of generating functions. We begin with a study of the Boltzmann samplers of Flajolet and collaborators, a useful method for generating large discrete structures at random which is useful both for providing intuition and conjecture and as a possible proof technique. We then apply generating functions and Boltzmann samplers to three main classes of objects: permutations with weighted cycles, involutions, and integer partitions. Random permutations in which each cycle carries a multiplicative weight σ have probability (1-γ)σ of having a random element be in a cycle of length longer than γn; this limit law also holds for cycles carrying multiplicative weights depending on their length and averaging σ. Such permutations have number of cycles asymptotically normally distributed with mean and variance ~ σ log n. For permutations with weights σk = 1/k or σk = k, other limit laws are found; the prior have finitely many cycles in expectation, the latter around √n. Compositions of uniformly chosen involutions of [n], on the other hand, have about √n cycles on average. These can be modeled as modified 2-regular graphs. A composition of two random involutions in Sn typically has about n1/2 cycles, characteristically of length n1/2. The number of factorizations of a random permutation into two involutions appears to be asymptotically lognormally distributed, which we prove for a closely related probabilistic model. We also consider connections to pattern avoidance, in particular to the distribution of the number of inversions in involutions. Last, we consider integer partitions. Various results on the shape of random partitions are simple to prove in the Boltzmann model. We give a (conjecturally tight) asymptotic bound on the number of partitions pM(n) in which all part multiplicities lie in some fixed set n, and explore when that asymptotic form satisfies log pM(n) ~ π√(Cn) for rational C. Finally we give probabilistic interpretations of various pairs of partition identities and study the Boltzmann model of a family of random objects interpolating between partitions and overpartitions.
20 April 2010
Thesis margins
What's the point of having two thousand readers if I can't ask a question like this once in a while?
I'm working on the final version of my dissertation -- the one I'll submit to the graduate school next week. The dissertation manual states that no text may appear in the margin area.
LaTeX, on the other hand, keeps wanting to put some pieces of mathematics, which appear inline, in the margins. (Presumably this is because this is "better" than the alternative of having very long inter-word spaces.)
Two questions:
- is there some way to check that nothing's sticking out in the margin? (I thought this is what "overfull \hbox" meant, but the line numbers where those appear aren't the ones where I have this problem.) There are some things that are just barely sticking out into the margin, and with thousands of lines total I don't trust my eye.
- once I find all the places where text protrudes into the margin, is there some way around this other than just inserting \newline every time this problem occurs? This creates its own problems.
I surely can't be the only person who's had this problem, but Google is failing me.
Ash clouds and probability
From the Daily Mail: New ash cloud could delay re-opening of London airports. We have this gem: "Critics said the agency used a scientific model based on 'probability' rather than fact to forecast the spread of the ash cloud." See the Telegraph as well.
What else are they supposed to do? The agency here -- the Met Office, which is the national weather service of the UK -- doesn't know what the ash cloud is going to do. If they waited to see what the cloud does, the planes would already be in the air. It would be too late.
What else are they supposed to do? The agency here -- the Met Office, which is the national weather service of the UK -- doesn't know what the ash cloud is going to do. If they waited to see what the cloud does, the planes would already be in the air. It would be too late.
14 April 2010
Mathematical relationships search
There's a mathematical relationships search. It will tell you, for example, that academically, Max Noether is the first cousin of Emmy Noether. (Both of their advisors were students of Jacobi.) But Michael Artin and Emil Artin aren't even related.
It's less amusing, of course, when you search for people that aren't related in the standard way. But Paul Erdos is my great-great-great-great-uncle. (You can't search for me yet in the Mathematics Genealogy Project, which is where the data comes from; the link goes to the relationship between Erdos and another student of my advisor.)
It's less amusing, of course, when you search for people that aren't related in the standard way. But Paul Erdos is my great-great-great-great-uncle. (You can't search for me yet in the Mathematics Genealogy Project, which is where the data comes from; the link goes to the relationship between Erdos and another student of my advisor.)
This blog needs a new title
The word "probability" does not appear in the Bible, or so we learn from Conservapedia's List of missing words in the Bible.
I can only conclude that Einstein was right, and God does not play dice.
I can only conclude that Einstein was right, and God does not play dice.
25 March 2010
My 27th-generation advisor is Elissaeus Judaeus
Mathematical ancestors of Penn math faculty, from October 1999. (This was the department's 100th anniversary.) This lists the advisor's advisor's advisor's... until historical data that was (easily?) available at that time gave out. The longest-ago person listed on this page is Otto Mencke (Ph. D. 1665, 12 generations from Penn professor Stephen Shatz); most chains die out in the 19th century.
As of right now, the math genealogy project claims to know that my advisor's 26th-generation advisor is Elissaeus Judaeus (who was a student in the 1380s). Most mentions of Judaeus on the Internet seem to be by other people who have discovered this (Judaeus has 77000 or so mathematical descendents). But this post from the person who added him to the database gives some background -- he was for the most part a philosopher, it seems. He is described as "a mysterious figure who may or may not have been a Jew". His student Gemistus Pletho seems a little better understood; Wikipedia says "He was one of the chief pioneers of the revival of Greek learning in Western Europe." It seems that in that time a lot more data has been collected for the 14th through 17th centuries.
(As for me, hopefully in a few weeks it'll be possible to add me to the mathematical genealogy project. I defend on April 15.)
18 March 2010
One down, six to go
Perelman has been awarded the Millennium Prize. Press release from the Clay Math Institute.
As Peter Woit points out, no mention of the fate of the million dollars.
As Peter Woit points out, no mention of the fate of the million dollars.
March Math Madness
From quomodocumque: what would the NCAA tournament look like if every game were won by the college or university with the better math department? (Berkeley -- excuse me, "California", as they're usually called in athletic contexts -- wins.)
Rather interestingly, 20 out of 32 first-round "games", and 37 out of 63 "games" overall -- more than half -- are won by the team that actually has the better seed in the basketball tournament. I suspect this is because quality of math departments and basketball teams are both correlated with the size of the school. This is especially true because ties were broken by asking how many people they could name at the school., which clearly has a bias towards larger departments.
Rather interestingly, 20 out of 32 first-round "games", and 37 out of 63 "games" overall -- more than half -- are won by the team that actually has the better seed in the basketball tournament. I suspect this is because quality of math departments and basketball teams are both correlated with the size of the school. This is especially true because ties were broken by asking how many people they could name at the school., which clearly has a bias towards larger departments.
17 March 2010
A puzzle about polynomials
I have a polynomial, P, with nonnegative integer coefficients. You want to know what it is. For any algebraic number x, you're allowed to ask me what P(x) is. How many questions do you have to ask me to be sure that you know what P is?
16 March 2010
McDonalds: more than 10 served
Megabus.com adds Philadelphia-D.C. line, from the Daily Pennsylvanian.
We learn from a Megabus spokesperson that their vehicles use "less than a pint of fuel per passenger mile".
For those of you who don't have the misfortune of knowing this, there are eight pints in a gallon. So these busses get better than eight passenger-miles to the gallon!
Since most cars in the US get at least 20 miles or more to the gallon, this is really nothing to be proud of.
(I'm guessing that busses are actually more fuel-efficient than cars, at least if they run sufficiently full.)
14 March 2010
The Calkin-Wilf shirt
You can actually buy a shirt with the Calkin-Wilf tree on it. I probably should buy it, if only so I can wear it when I inevitably give a talk on this subject again, either as a stand-alone talk (I've done it twice) or when I teach it in a class.
This is an infinite binary tree of rational numbers. It has 1/1 at the root, and the children of r/s are r/(r+s) and (r+s)/s. It turns out that this tree contains every positive rational number exactly once, giving an explicit enumeration of the rational numbers.
Also -- and this is what's really surprising to me -- let f(n) be the number of ways to write n as a sum of powers of 2, where no power of 2 can be used more than twice. Then (f(0), f(1), f(2), ...) = (1,1,2,1,3,2,3,1,4,3,5,2,5,3,4,...). The sequence of numbers f(n)/f(n+1) are the rational numbers in that tree, in the order which they appear if you traverse each level from left to right.
I learned about the shirt from this mathoverflow thread, where Richard Stanley gives the theorem of the previous paragraph as an example of a theorem with an "unexpected conclusion".
See the original paper by Calkin and Wilf. I've mentioned it before here and here. I think I first heard of this paper from Brent Yorgey's series of posts expanding upon the paper, or perhaps from Mark Dominus' blog. (Somewhat coincidentally, Yorgey and Dominus both live in Philadelphia. I claim this is coincidence, even though Wilf is at Penn, because I don't think either of them heard about the paper from Wilf.)
And can anything nice be said about the number of ways to write n as a sum of powers of 3, where no power of 3 can be used more than three times?
09 March 2010
People round their incomes to the nearest $5,000?
Here's something interesting: lots of people, when asked by the US Census Bureau "how much money do you make?", round to the nearest five thousand dollars.
See the data tables from the 2006 census. These give the number of people whose personal income is in each interval of the form [2500N, 2500N+2499], for integer N.
One sees, for instance, that the number of people making between $27,500 and $29,999 (which is near the mode of the distribution) is less than both those making $25,000 to $27,499 and those making $30,000 to $32,499. Something similar occurs at all income levels -- the number of people making between 2500N and 2500(N+1)-1 dollars is smaller if N is odd (and thus this interval doesn't contain a multiple of 5000) than if N is even (and so it does).
Surprisingly, the effect occurs even at very low levels of earnings. If you make $87,714 in a year I can see rounding to $90,000 -- but is the person who makes $7,714 in a year really rounding to $10,000?
(I found this while trying to answer a question at Metafilter: How many people in the United States make more than $10,000,000 per year?. I seem to recall reading somewhere that personal income roughly follows a power law in the tails, but can't actually find a reference for this.)
There also seems to be a preference for multiples of $10,000 over multiples of $5,000 that are not multiples of $10,000. But I have work to do, so I'm not going to do the statistics.
03 March 2010
Turning clocks upside down
Apparently this is a puzzle blog now.
This morning at 9:30 I picked up my watch and turned it upside down. It appeared to read 4:00. The hour hand was actually in the position it would be at at 3:30, of course. But the minute hand was pointing straight up, so the time must be on the hour. Since I could easily tell that the hour hand wasn't pointing directly to the right, I suppose my brain interpreted it as 4:00 instead of 3:00. Of course I did not think any of this consciously, but only reconstructed it after the fact; my thought process was more like "hey, 9:30 upside down looks like 4:00. that's weird."
Is it ever possible to interpret the hands of a clock, turned upside-down (i. e. rotated by 180 degrees), unambiguously as a time? (Fudging like my brain apparently did this morning does not count.)
01 March 2010
A puzzle with lights
Since I seem to be getting this question a lot lately: yes, I'm still alive! But I am writing a dissertation. (And waiting to hear back from places where I applied for jobs, but that is not an excuse because those applications are already out there.)
Here's a puzzle I heard a couple weeks ago. You have a 10-by-10 grid of lights. Some of them are on, some are off. You are allowed to make the following moves:
(a): you pick one of the lights which is the center of some 3-by-3 square (i. e. it is not on the edge of the grid) and switch all the lights in that 3-by-3 square (on becomes off, off becomes on).
(b): like in (a), but with a 5-by-5 square.
Is it possible to get from an arbitrary starting position to the all-off position?
12 January 2010
"Orthogonal" at the Supreme Court
Orin Kerr at the Volokh Conspiracy points to arguments in a U. S. Supreme Court case yesterday which used the word "orthogonal" in the technical-jargon sense defined, say, at the Jargon File. (See page 24 of the original transcript.) There's a follow-up here by Eugene Volokh, basically saying that there's no point in using big words if your audience doesn't understand them. (And the justices did stop to ask what the word meant.)
07 January 2010
How most mathematical proofs are written
From Abstruse Goose: How most mathematical proofs are written, dramatized as people driving around and getting lost.
Sometimes I've wondered what an actual map of the various possible proofs of certain results would look like.
Sometimes I've wondered what an actual map of the various possible proofs of certain results would look like.
02 January 2010
Magic and mathematics
Sunday's New York Times has a bunch of magic tricks based on simple algebra, by Arthur Benjamin.
For some magic tricks based on "deep" mathematics, check out this mathoverflow thread. Rumor has it that Persi Diaconis thinks there's no such thing, though, and he would know.
For some magic tricks based on "deep" mathematics, check out this mathoverflow thread. Rumor has it that Persi Diaconis thinks there's no such thing, though, and he would know.
Subscribe to:
Posts (Atom)

