11 May 2010

The NIST Handbook of Mathematical Functions

The National Institute of Standards and Technology has released what you might call a "trailer" for the revised edition of Abramowitz and Stegun's Handbook of Mathematical Functions. The original version is available online (it's public domain).

The print version is called the NIST Handbook of Mathematical Functions, and is available in hardcover and paperback.

There is also, not surprisingly, an online version, the Digital Library of Mathematical Functions, which takes advantage of new technology: three-dimensional graphics, color, etc. Think MathWorld, but less idiosyncratic. It jsut went public today.

And it includes Stanley's Twelvefold Way, which makes me smile.

However, some small part of the original Handbook's primacy as a reference comes from the fact that in a list of papers which are alphabetical by last name of the first author, it usually comes first. The first editor of the new book is Frank Olver, so it won't have that advantage.

07 May 2010

Fibonacci cutting board

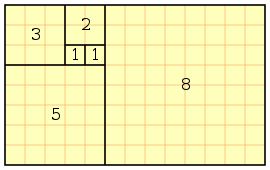
The Fibonacci cutting board is being sold by 1337motif at etsy. (Note: that's pronounced "leetmotif"; it took me a while to figure it out.) It's basically this tiling, where a rectangle of size Fn by Fn+1 is repeatedly decomposed into a square of size Fn by Fn and a rectangle of size Fn-1 by Fn, but made of wood instead of pixels.

There's also the double Fibonacci cutting board made in a similar pattern.

1337motif is Cameron Oehler's work. Nost of his other work is inspired by video games; you can see it here. I wonder how often the cutting boards get used as cutting boards; at $125, if I had one I'd hang it on the wall and not get food on it. Personally, I'd like a Sierpinski triangle cutting board.

05 May 2010

Proof Math is Beautiful

Proof Math is Beautiful is a blog of pictures which come from mathematics.

Street-Fighting Mathematics is a book

From the Chronicle of Higher Education: The Gospel of Well-Educated Guessing, on Sanjoy Mahajan's Street-Fighting Mathematics. (Previously: here, and here.) It's now a real book!


Here's a calculation I hadn't heard of before, and don't actually know the details of:
They were both right, in a sense: some of the calculations he pulls off have a hint of Houdini. For instance, he can start with two paper cones, to find the relation between drag force and velocity, and—believe it or not—arrive at the cost of a round-trip plane ticket from New York to Los Angeles. He works out the problem in a blur of equations, remarking that a gram of gasoline and a gram of fat contain the same amount of energy, that drag force is proportional to velocity squared, and so on. The number he arrives at ($700) isn't the cheapest deal out there, but it's roughly right.

I've recently priced PHL-(SFO/OAK) flights, and this is roughly right. (And this uses chemistry, which is awesome because I was a chemist in a former life. Gasoline and fat are both basically long chains of carbon atoms.) The article tells of other similar party tricks. It would be nice to see some details, but the Chronicle seems to pitch itself at a humanities-ish audience.

02 May 2010

Arithmetic geometers write about statistics

Jordan Ellenberg, in yesterday's Washington Post: The census will be wrong. We could fix it.

This continues a proud tradition of mathematicians whose area of expertise is nowhere near statistics writing newspaper pieces saying that statistical sampling in censuses a good idea; Brian Conrad, 1998, New York Times.

In some sense it carries more weight when mathematicians who don't spend most of their time battling randomness in some sort or another . Statisticians of course think that doing statistical adjustments to the census in order to make it more accurate is a Good Idea; it gets them, their students, or their friends jobs!

As a combinatorialist I admire the theoretical elegance of our country's once-a-decade exercise in large-scale, brute-force combinatorics. But in practice, well, of course it needs some statistical help.

And here's something interesting:
Since 1970, a mail-in survey has provided the majority of census data, so what we enumerate is not people but numbers written on a form, which are as likely to be fictional as any statistical estimate.
I wonder if people are actually lying on their census forms. I suspect this would skew the count upwards. People who deliberately lie on their census forms, at least the sort of people I know, are likely to give "joke" answers. And large numbers are funnier. I live in a one-bedroom apartment, and if I were the sort of person who lied on government forms I would easily say that ten people live in my apartment. I can't give a comically low number of people living here, because the census insists that a positive integer number of people live in each place. Does the census has some sort of way to correct for this?

01 May 2010

The probability that 901 coins have total value $100

Here's a cute little problem from Reddit: Tough question for you guys. Let's say you have 901 coins that come out to exactly $100. What are the odds? (Also here.)

Everyone there who gets a solution is assuming that all the possible coins are equally likely, which isn't a reasonable assumption. Years ago I looked at the density of money, where I used a model in which I get back from each transaction n cents with probability 0.01, for n = 0, 1, ... 99; furthermore I always get back the smallest possible number of coins. The only coins allowed are pennies, nickels, dimes, and quarters (worth 1, 5, 10, and 25 cents respectively).

As I calculated before, if I make 100 transactions, and I get each number of cents back exactly once, I'll get 200 pennies, 40 nickels, 80 dimes, and 150 quarters. This is a total of 470 coins, and worth $49.50. Thus the "average coin" is worth 495/47 = 10.53 cents; 901 coins are "on average" worth $94.89. The value $100 isn't that unreasonable.

So consider a jar with 901 coins, which are independent; they each have probability 20/47 of being a penny, 4/47 of being a nickel, 8/47 of being a dime, and 15/47 of being a quarter. The mean value of a coin is 495/47 = 10.53 cents; the variance is 238840/2309 = 108.12 "square cents".

The mean value of 901 coins, then, is 9489 cents; the variance is 93198 "square cents", so the standard deviation is 305 cents. (Everything here is rounded to the nearest integer.)

Invoking the central limit theorem, then, we say that the value of 901 randomly chosen coins is normally distributed with this mean and standard deviation. The probability of having value exactly 10,000 cents is approximated by the probability density function of this variable at 10,000; that's 0.000322, or 1 in 3101.

An exact answer is feasible -- but not worth computing, I'd say, because the error in the central limit theorem is surely much smaller than the error from the fact that this isn't a realistic model of what actually ends up in your change jar.

29 April 2010

A simple model for baseball

From the April Notices of the AMS, John D'Angelo writes Baseball and Markov Chains: Power Hitting and Power Series. Consider the following simple model of baseball. Players only hit singles; three singles score a run. That is, the third and every following player to get a hit in a given inning score a run. This can either be interpreted as that, say, all runners score from second on a single or all runners go from first to third on a single -- but not both! -- or that every third hit is actually a double. (And I do mean exactly every third hit, not some random one-third of hits, so this is a bit unnatural.) Then the expected number of runs per half inning is p3(3p2-10p+10)/(1-p). For real baseball the average number of runs per half-inning is around one half, which corresponds to p = 0.361.

D'Angelo gives this as an exercise, but I independently came up with this model a while ago and can't resist sharing the solution. Let q = 1-p. The probability of getting k hits in an inning is pk q3 -- that's the probability of getting those hits in a certain order -- times the number of ways in which k hits and 3 outs can be arranged. Since the last batter of an inning must get out, the number of possible arrangements is the number of ways to pick 2 batters out of the first k+2 to get out, which is (k+2)(k+1)/2.

The probability of getting k runs, if k is at least 1, is just the probability of getting k+2 hits, which is pk+2q3(k+4)(k+3)/2. Call this f(k); then

f(1) + 2f(2) + 3f(3) + ... = p3(3p2-10p+10)/(1-p)

by some annoying algebra. I'm pretty sure I came up with this exact model while procrastinating from some real work a couple years ago; it's probably been independently reinvented many times.

With p = 0.361, the probabilities of scoring 0, 1, 2, 3, 4, 5 runs in an inning are .748, .123, .066, .034, .016, .008 (rounded to three decimal places). (Probabilities of larger numbers of runs can also be calculated; together they have probability around .006.)

Assuming that each half-inning is independent, the probability G(k) of a team scoring k runs in a game is, for each k,


k012345
G(k).073.108.129.133.124.108
k67891011
G(k).088.069.052.038.026.018
k121314151617
G(k).012.008.005.003.002.001

with probability about 0.0006 of scoring 18 runs or more. (This seems a bit low to me -- three times a season in the major leagues -- but after all this is a very crude model!) But one interesting thing here is that the distribution of the number of runs per game, which is a sum of nine skewed distributions, is still skewed; the mode is 3, and the median 4. Recall that I chose p so that the mean would be 4.5. And the actual distribution is similarly skewed.

Of course a more sophisticated model of baseball is as a Markov chain. There are twenty-five states in this chain -- zero, one or two outs combined with eight possible ways to have runners on base, and three outs. We assume that each hitter hits randomly according to his actual statistics, and the runners move in the "appropriate" way. Of course determining what's appropriate here would be a bit tricky. How do runners move? A runner is probably more likely to take an extra base when a power hitter is hitting, but the sample size for any individual is fairly small. But one could probably predict from some measure of the hitter's power (say, the number of doubles and home runs, combined appropriately) the chances of a runner taking an extra base on a single. Something similar is necessary for sacrifice flies (which have to be deep enough to score the runner), grounding into double plays, etc. I'm not sure if the Markov models that are out there, such as that by Sagarin, do this. Sagarin computes the (offensive) value of a player by determining how many runs per game a team composed of only that player would score.